Choose a report
Open Reports: in the sidebar on the web, or in the tab bar of the app (on Android it can also be under More). Pick the report that answers your question:
The web list has a few more reports, such as Forex & Capital Gains and Net Worth Change. This article covers the first four rows.
- Web
- Android
- iOS
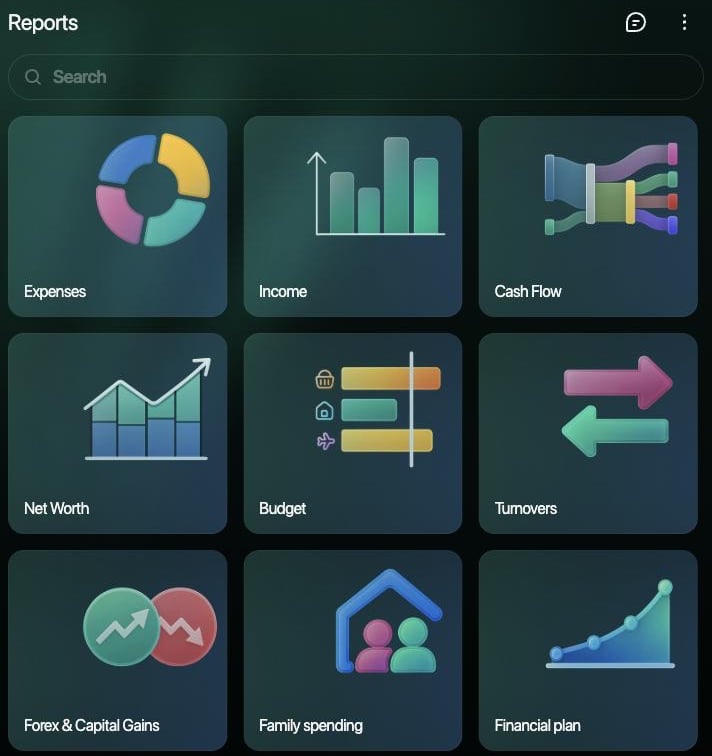
Open Reports in the sidebar.
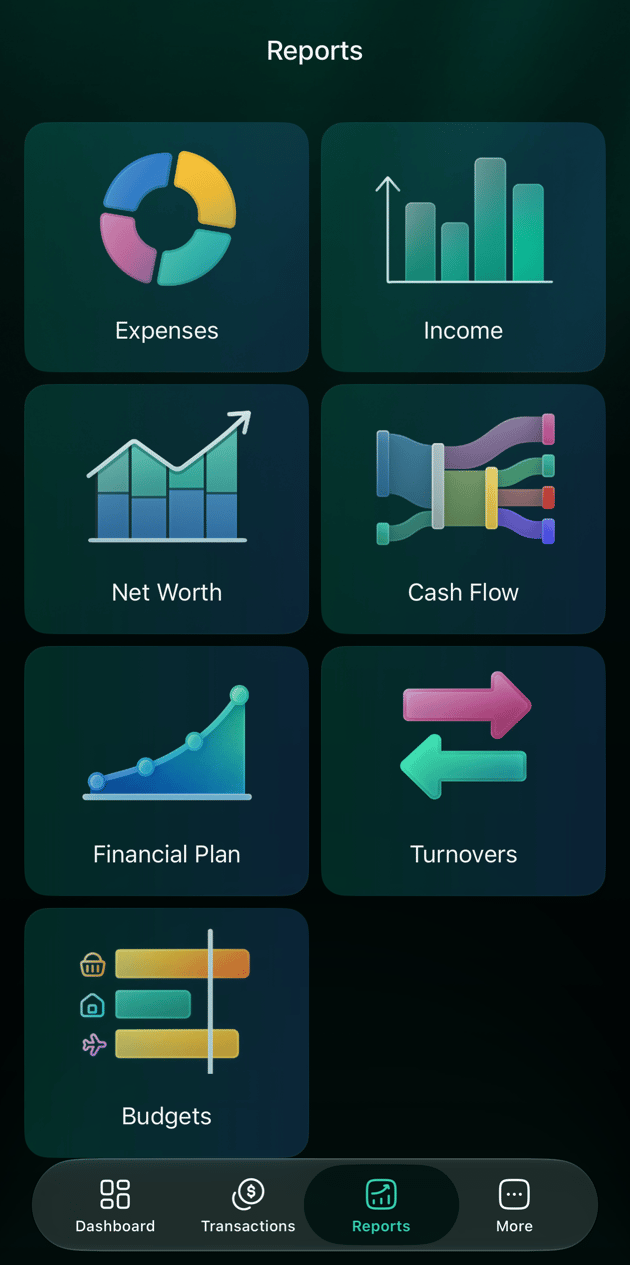
Expenses and income by category or merchant
Expenses shows how much you spent in each period and on what; Income does the same for money you earned. At the top is the total for the whole period and how it changed against the previous period of the same length: a rise in expenses is shown in red, a fall in green. The report counts every expense and income in your space, including bank transactions that are still pending:- Categories are grouped under their parent: Electronics and Clothing count in Shopping. Open a parent to see its subcategories.
- A refund lowers spending in its category instead of counting as income, see How a refund is counted. A month that has only refunds in a category shows a negative amount.
- Each part of a split counts in its own category, see How a split is counted.
- Transfers between your accounts, debts, and balance corrections aren’t expenses or income, so they don’t appear, see Move money between your accounts.
- Amounts in other currencies are converted to your primary currency at the rate of the transaction’s date.
- Transactions without a category appear as Uncategorized Expense or Uncategorized Income.
- Web
- Android
- iOS
- In Reports, select Expenses or Income. The first menu at the top switches between Expenses and Income without leaving the page.
- Choose By category or By merchant, and set Category, Merchant or Tag to filter. Clear filters returns to the full report.
- Read the chart and the table below it. In the table, select the arrow next to a parent category to show its subcategories.
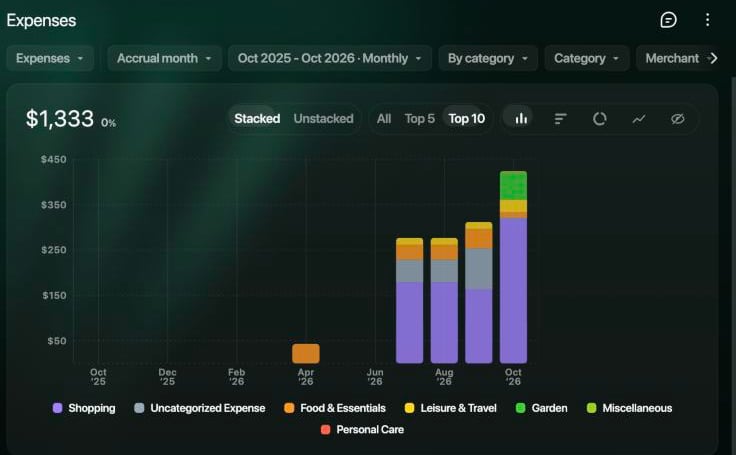
Expenses by category, month by month.
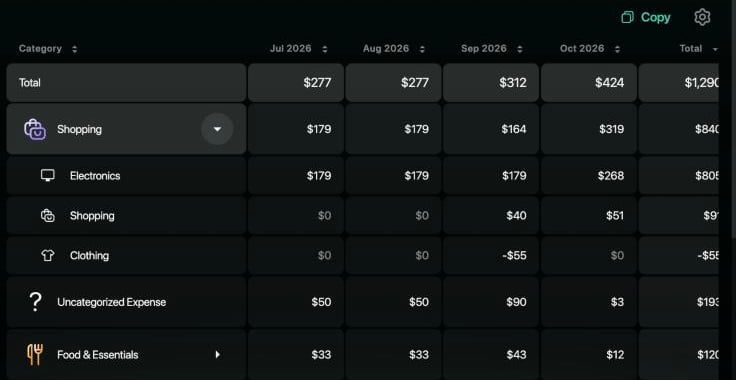
The table with Shopping opened: a refund in September made Clothing negative.
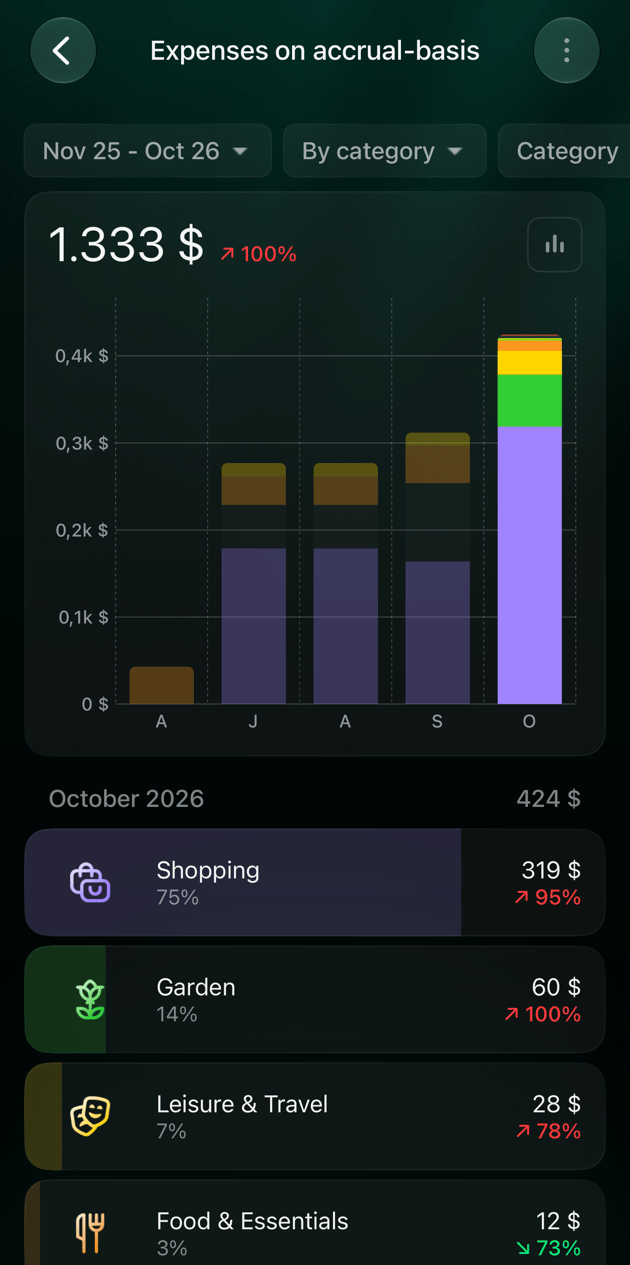
Period, detail and date
The period at the top sets the dates and the step of the report: Month, Quarter, Year, or Custom for any dates split by days or weeks. The web and iOS open on the past year month by month; Android opens on the last 6 months. Expenses and Income count each transaction in its Accrual month by default; switch to Transaction date to match your bank statement. On the web, the buttons above the chart change how it looks: columns, a ranking of bars, a ring, lines, or no chart. Top 5 and Top 10 show the biggest categories and group the rest; All shows only the totals. On Android and iOS, the chart button next to the total switches between Bar chart, Pie chart and Line chart. For the steps, the difference between the two date settings, filters and saving a set-up as your own report, see Customize a report.See the transactions behind a number
Any amount in a report can be opened down to the transactions that make it up. finerd keeps the report’s period, filters and date setting. A split transaction is listed with its full amount, even though only its part counts in the number you opened.- Web
- Android
- iOS
- An amount in the table opens Transactions for that row and period: for a category, with its subcategories. A Total column opens the whole period.
- A category name narrows the report to that category: you see its subcategories, or its merchants if it has none.
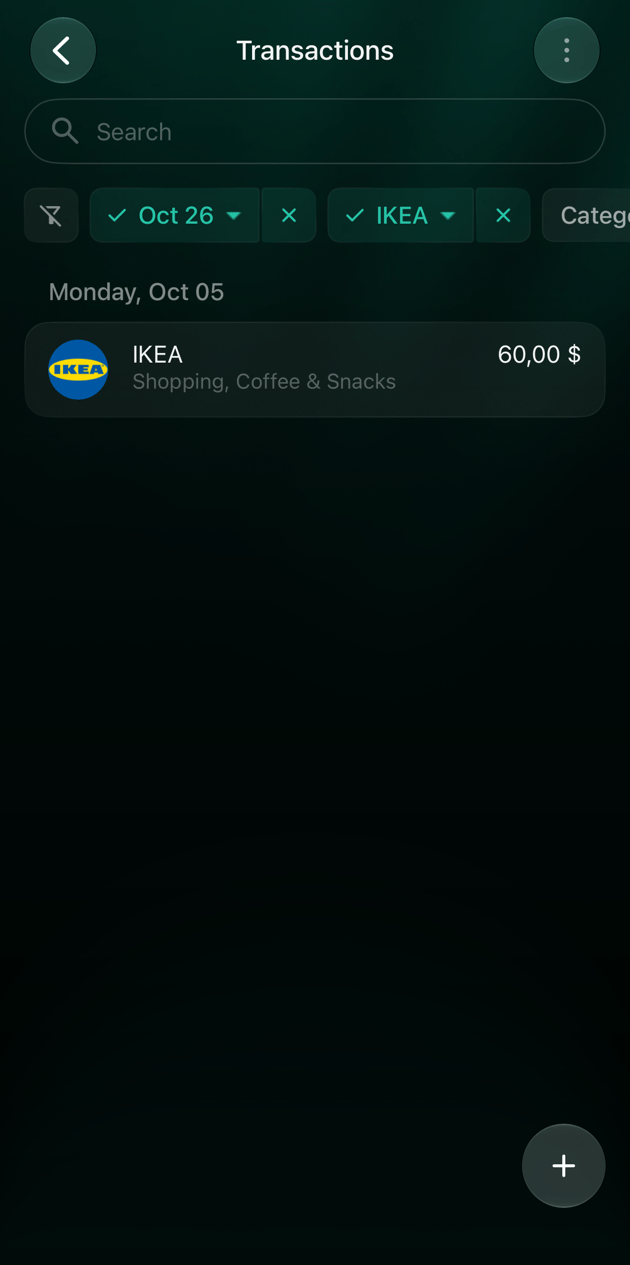
- A merchant name opens its transactions for the whole period.
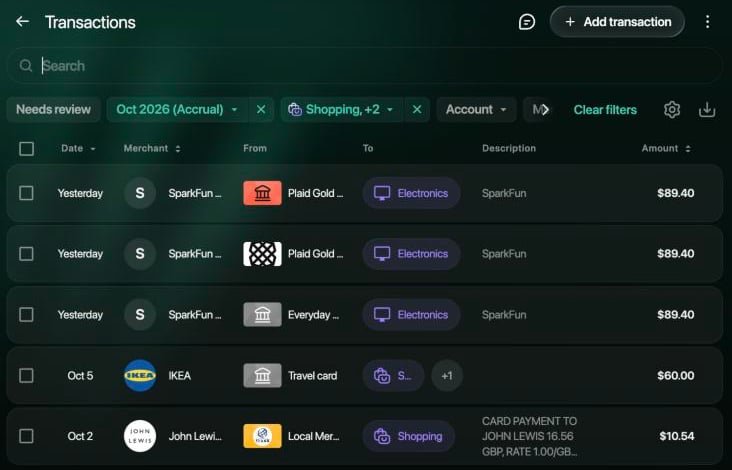
Shopping in October 2026 opened from the table.
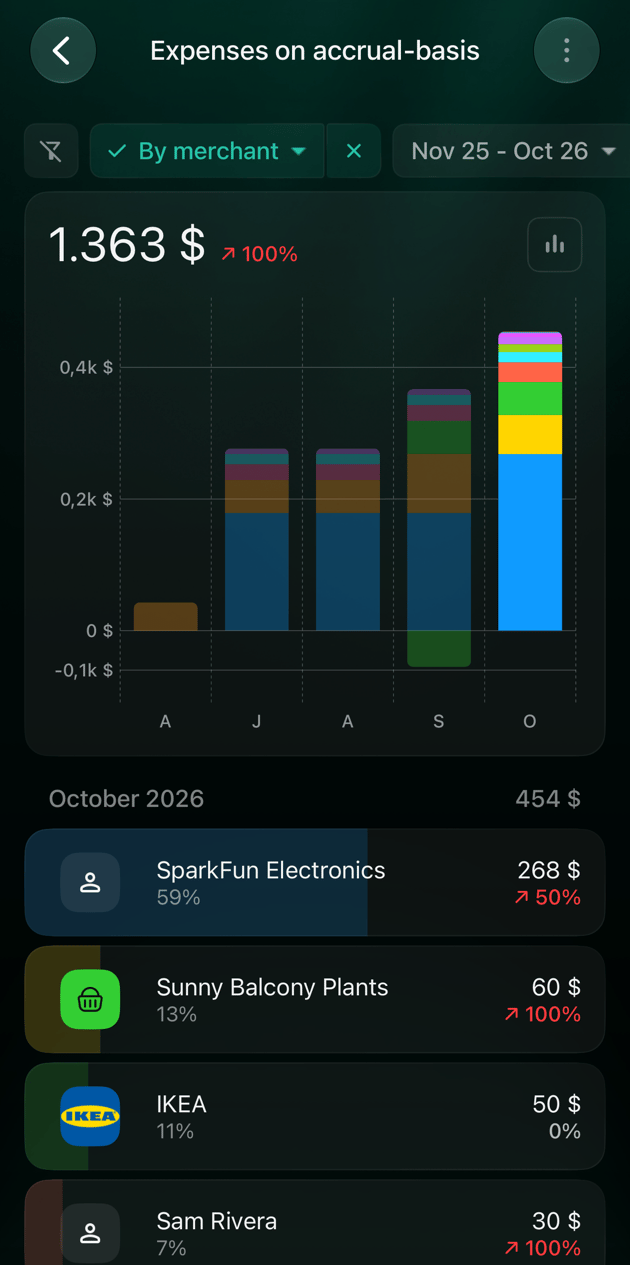
Cash flow
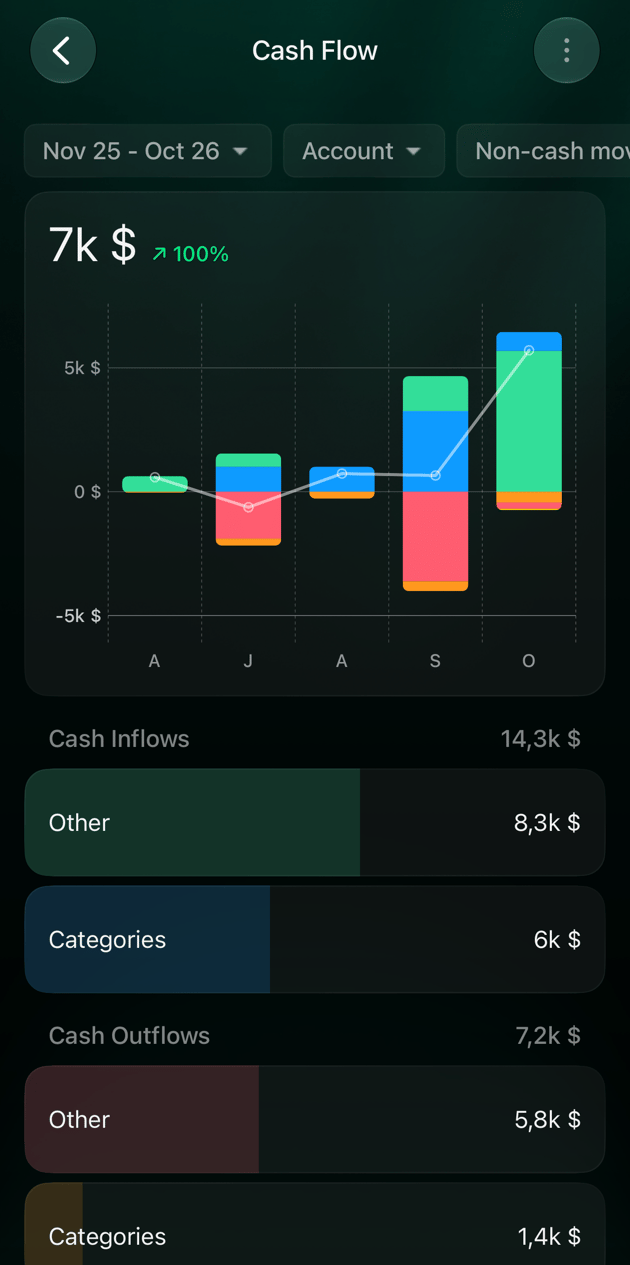
Cash Flow follows the money in your bank, cash and Money on the way accounts: what came in, what went out and the net change over the period. It answers a different question from Expenses: not what you spent on, but whether your accounts grew. Money in and out is grouped by where it came from or went to:
Transfers between your own accounts cancel out and don’t appear. Cash Flow always uses the transaction date.
Non-cash movements are amounts that don’t pass through a money account, such as loan interest added to the debt or income reinvested in an investment account. They’re included unless you choose Hide.
- Web
- Android
- iOS
- In Reports, select Cash Flow.
- Set the period, and use Account to keep only some accounts or Non-cash movements to hide those.
- The diagram shows the money coming in on the left and where it went on the right, with Net change in cash at the top. Select a name in the diagram to find its row in the table.
- In the table, Cash Inflows and Cash Outflows open into their groups, then accounts or categories. Select an amount to open its transactions.
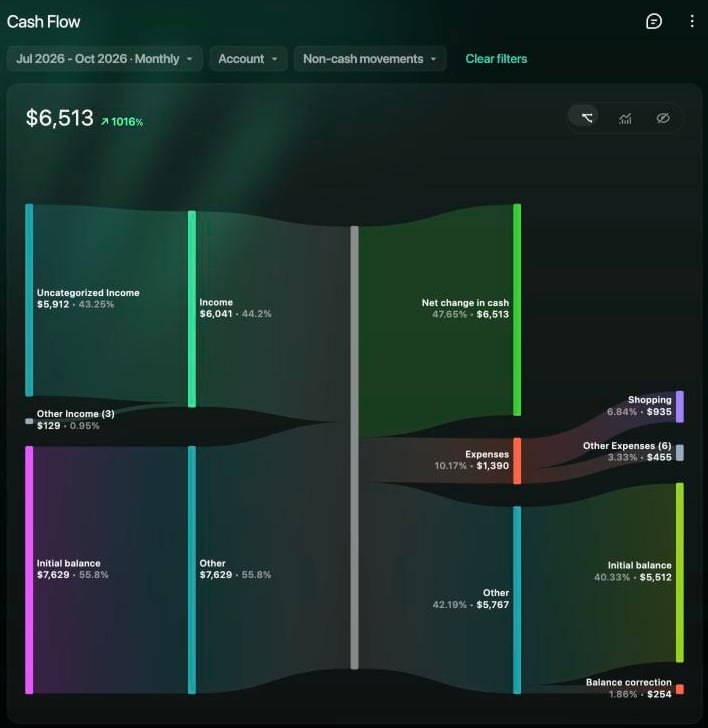
Cash Flow for July–October 2026.
Family spending
When you and your partner are connected through Family, each expense or income in your space is one of three kinds: Personal, Family (Me) (shared, you paid) or Family (Partner) (shared, your partner paid). A shared expense your partner paid counts in your Expenses too, but not in your Cash Flow, because the money didn’t leave your accounts.- Web
- Android
- iOS
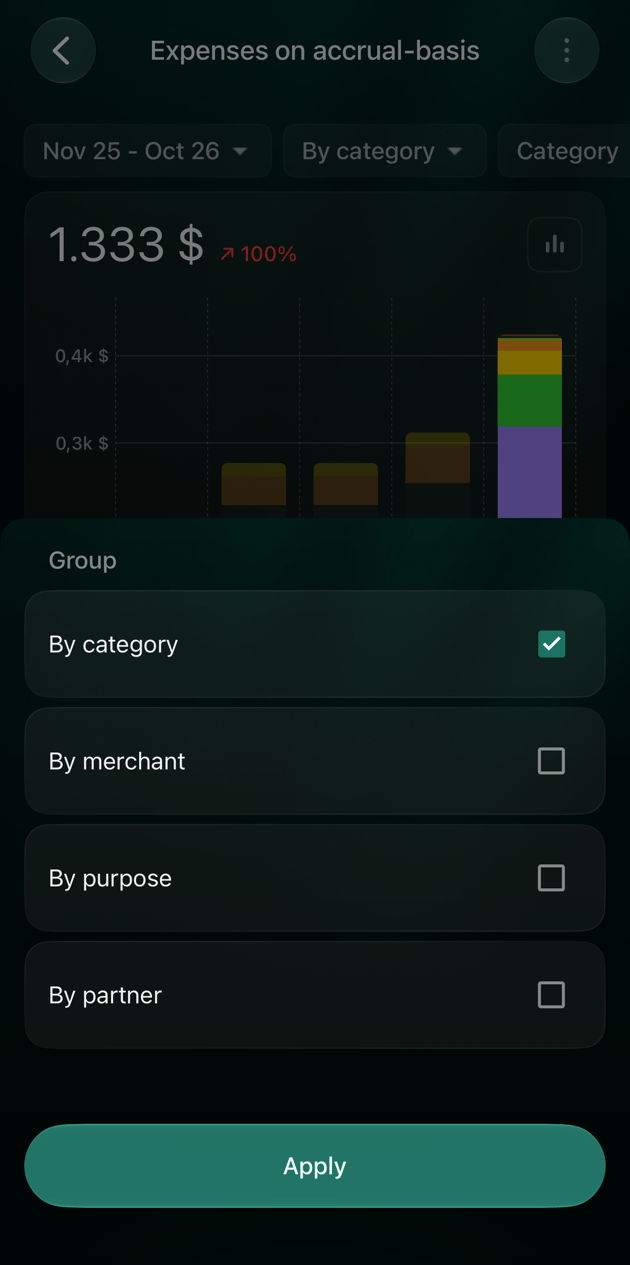
Open Reports → Family spending. The table shows each category in three columns, Personal, Family (Me) and Family (Partner), and a Total. Switch between expenses and income, group By category or By merchant, and pick the dates. This report counts by transaction date.The Expenses and Income reports also get a family filter, Personal & Family by default, and two groupings: By purpose (Personal or Family) and By partner (Paid by me or Paid by partner).Without a partner, Family spending shows Invite your partner.