> ## Documentation Index
> Fetch the complete documentation index at: https://help.finerd.ai/llms.txt
> Use this file to discover all available pages before exploring further.
# Understand your net worth
> See what you own and owe in finerd, compare balances over time, and separate money movements from changes in the value of your assets.
**Net Worth** shows the value of the accounts you track in finerd, minus what you owe. It brings money, investments, property and debts into one total, so you can see how your financial position changes over time.
Net Worth is free in your personal space on the web, Android and iOS. **Net Worth Change** is also free in your personal space, on the web only. The more detailed **Forex & Capital Gains** report is web-only and needs Pro. This article covers personal finances; **Balance Sheet** is a separate report for business spaces.
What net worth includes
Net worth is **assets minus liabilities**. For example, 8,000 USD in money plus a car valued at 12,000 USD, minus a 5,000 USD loan, gives a net worth of 15,000 USD. If what you owe is greater than what you own, the result is negative.
finerd uses the accounts and balances you have recorded:
| What you track | How it contributes |
| - | - |
| **Bank accounts** and **Cash** | Money held in your accounts. A negative balance lowers the total |
| **Stock & Crypto** | The value of the holdings recorded in those accounts |
| **Property** | The recorded value of real estate, vehicles and other property |
| **Loans & Mortgage** | The remaining amount you owe lowers your net worth |
| **Debt** | Money someone owes you raises your net worth; money you owe lowers it |
| **Money on the way** | Money moving between connected accounts is included too |
This is a guide to the main account types, not a separate list to fill in inside the report. Add missing accounts through [Create an account](/accounts/create-account); record people you owe or who owe you through [Track debts](/debts/track-debts).
All report totals are in your space's [primary currency](/getting-started/initial-setup#primary-currency). One account can hold several currencies or assets; finerd combines their values into one amount in the report. A change in an exchange rate or asset price can change that amount even when the quantity you hold stays the same. A property balance entered as 12,000 USD remains that recorded dollar amount until you update the balance; finerd does not appraise the car or home for you.
Open and read Net Worth
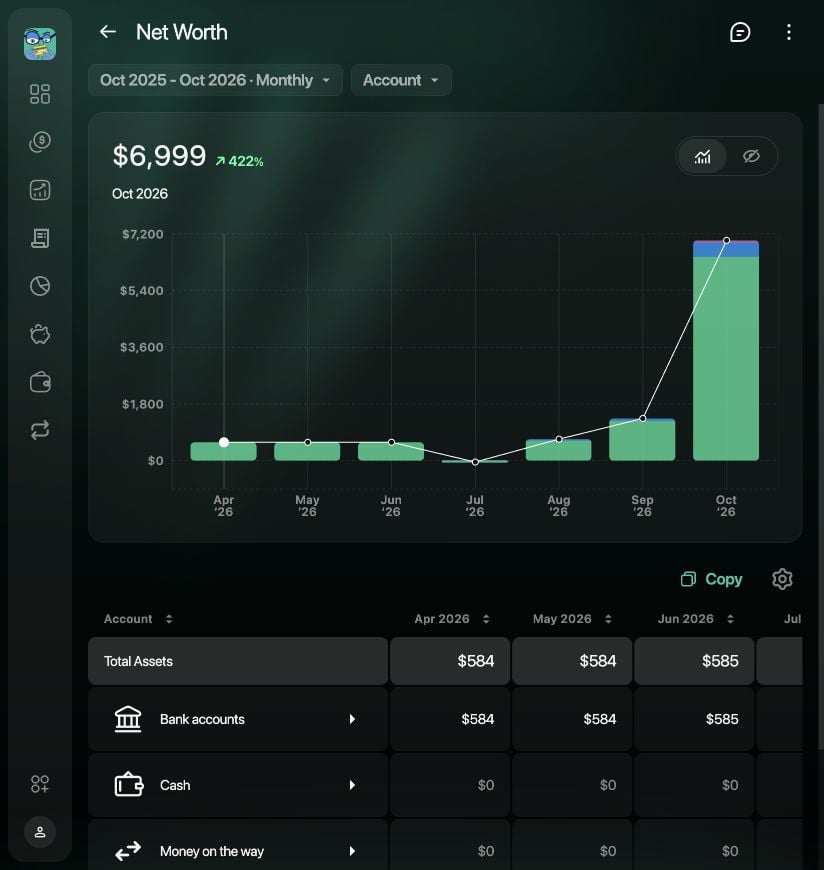
Each column is a balance at the end of a month, quarter or year, rather than the income earned during it. For the current period, the report uses recorded balances and current rates. The line shows net worth; the colored parts show the account groups behind it.
The groups follow account type, so read negative amounts with their signs. For **Loans & Mortgage**, a debt you owe must have a negative account balance: −5,000 USD appears as 5,000 USD in liabilities and lowers net worth. A positive loan-account balance has the opposite effect. In particular, money owed to you can appear as a negative amount under **Liabilities**: subtracting that amount increases net worth.
1. Open **Reports** in the sidebar, or under **More** if you have hidden it from the sidebar.
2. Select **Net Worth**.
3. Read the amount and period above the chart: they describe the last period in the report.
4. Below the chart, compare **Total Assets** and **Total Liabilities**. Select the arrow beside an account group to show its accounts. Scroll the table sideways to reach later periods if needed.
 1. Open **Reports** in the tab bar, or under **More**.
2. Tap **Networth**.
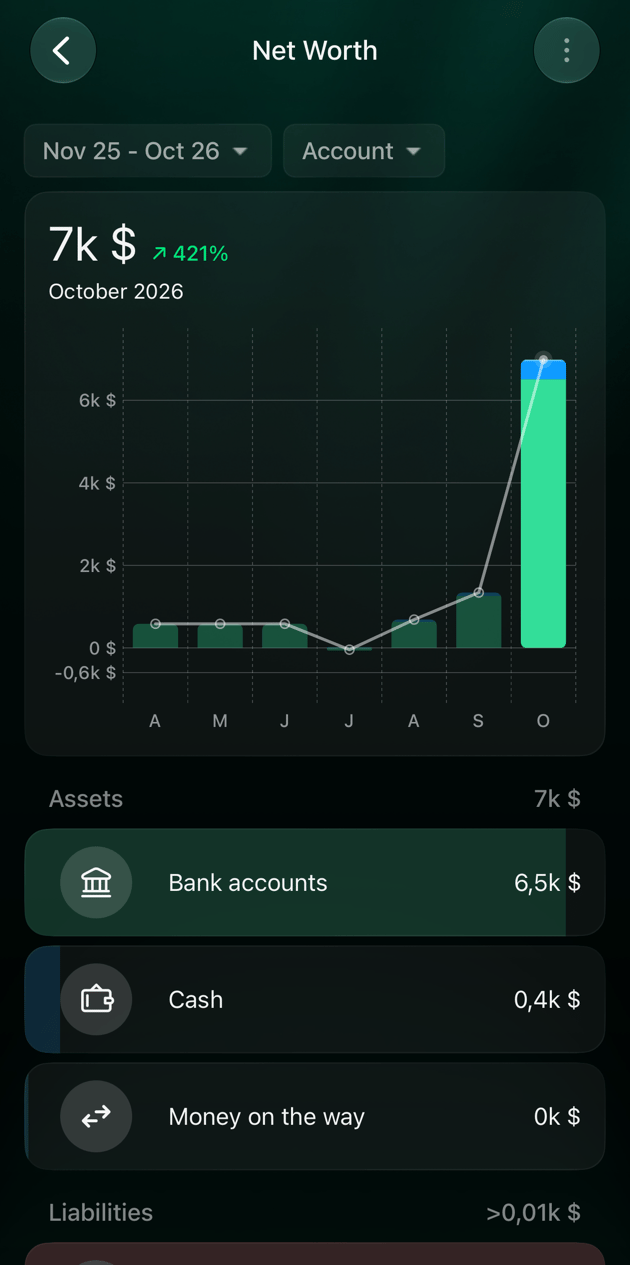
3. The last period starts selected. Tap another column to read that period's total and the **Assets** and **Liabilities** below it.
4. Tap an account group to see its accounts.
1. Open **Reports** in the tab bar, or under **More**.
2. Tap **Net Worth**.
3. The last period starts selected. Tap another column to change the date, total and list below the chart.
4. Under **Assets** or **Liabilities**, tap an account group to see its accounts.
1. Open **Reports** in the tab bar, or under **More**.
2. Tap **Networth**.
3. The last period starts selected. Tap another column to read that period's total and the **Assets** and **Liabilities** below it.
4. Tap an account group to see its accounts.
1. Open **Reports** in the tab bar, or under **More**.
2. Tap **Net Worth**.
3. The last period starts selected. Tap another column to change the date, total and list below the chart.
4. Under **Assets** or **Liabilities**, tap an account group to see its accounts.
Compare dates and accounts
Use **Month**, **Quarter** or **Year** to choose the distance between balance snapshots. Net Worth has no daily or weekly view and no accrual-month setting. To compare income and spending during those periods instead, use [Income, expenses and cash flow](/reports/income-expenses-cash-flow).
The account filter changes which accounts contribute to the total. **Include** keeps only your selection; **Exclude** leaves it out. A filtered total describes that selection, not all your finances.
1. Select the period above the chart.
2. Under **Granularity**, choose **Month**, **Quarter** or **Year**.
3. Select the first and last period in the grid, then **Apply**. A quick choice such as **This Month** applies immediately.
4. Select **Account**, choose **Include** or **Exclude**, select the accounts and then **Apply**. **Clear filters** returns to the default report.
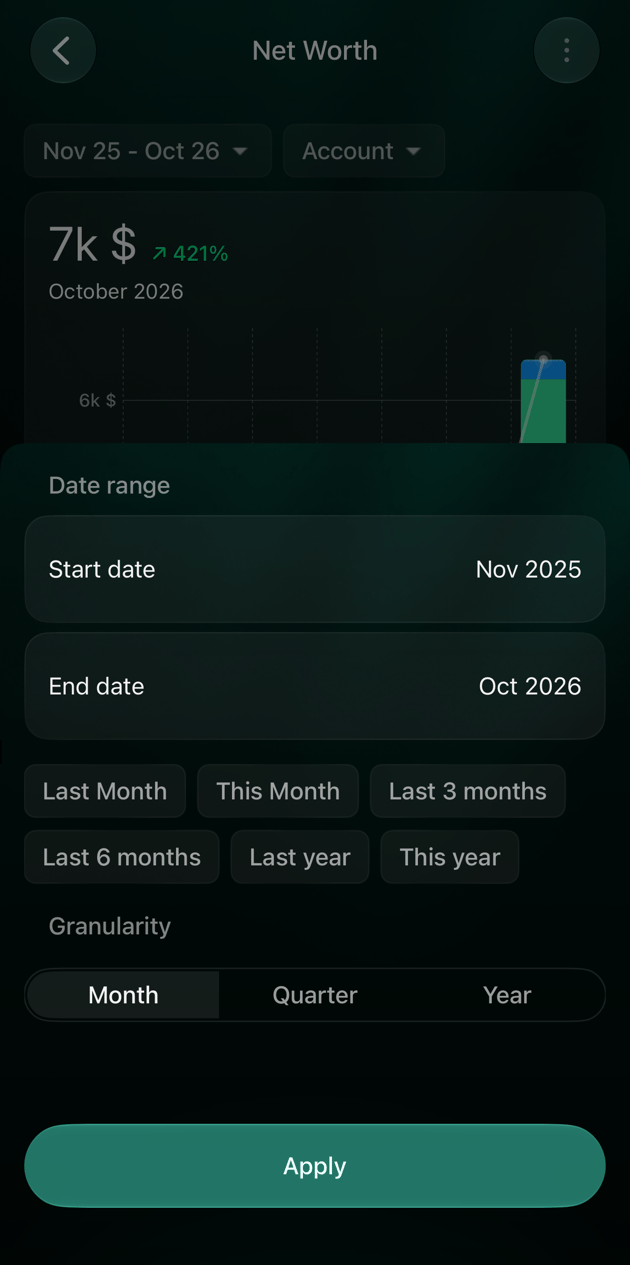
1. Tap the period above the chart.
2. Under **Granularity**, select **Month**, **Quarter** or **Year**. Then set **Start date** and **End date**, or use a quick choice, and tap **Apply**.
3. Tap **Accounts**, choose **Include** or **Exclude**, select the accounts and tap **Apply**.
1. Tap the period above the chart.
2. Under **Granularity**, choose **Month**, **Quarter** or **Year**. Then set **Start date** and **End date**, or use a quick choice, and tap **Apply**.
3. Tap **Account**, choose **Include** or **Exclude**, select the accounts and tap **Apply**.
Explain a change
A higher balance does not always mean new income. Transfers change individual accounts; an initial balance or balance correction changes the recorded balances; exchange rates and asset prices change the value of what you already hold.
Open **Reports** → **Net Worth Change** and choose the dates and accounts. You can also select an account name or an amount in **Net Worth** to open the change report for that selection. Selecting an amount uses that column's period; selecting a name uses the whole report period.
The columns explain the movement from the start to the end:
| Column | Meaning |
| - | - |
| **Opening** | Value just before the selected period starts |
| **Net flow** | Net movement into or out of the account, valued at the rates used for the transactions |
| **Realized gain** | Gain or loss recognized when holdings are sold or exchanged |
| **Unrealized gain** | Change in the unrealized gain or loss between the start and end |
| **Closing** | Value at the end of the selected period |
For a row, **Opening + Net flow + Realized gain + Unrealized gain = Closing**. Rounded display values can differ slightly when added together.
Expand a group, then an account, to see its individual currencies or assets. Select **Net flow** on an account or asset row to open **Turnovers**. Selecting **Realized gain** or **Unrealized gain** opens **Forex & Capital Gains**, which needs Pro.
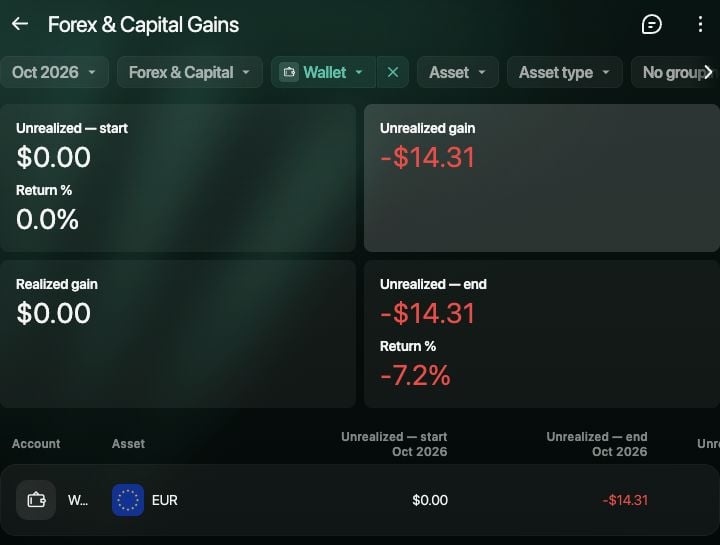
In **Forex & Capital Gains**, **Unrealized — start** and **Unrealized — end** are balances of unrealized gains at the two dates; **Unrealized gain** is their change. These are different numbers. The end view also shows **Cost basis** and **Market value** for the holdings.
For example, the test account below holds EUR with a cost basis of 200 USD and a market value of 185.69 USD. The difference is a 14.31 USD unrealized loss; it is not a new payment out of the account.
 Tap a column in **Networth**, then an account group and an account. **Turnovers** opens for that account and the period selected on the chart, with the balance changes behind it.
For the separate **Net Worth Change** and **Forex & Capital Gains** reports, use the web app.
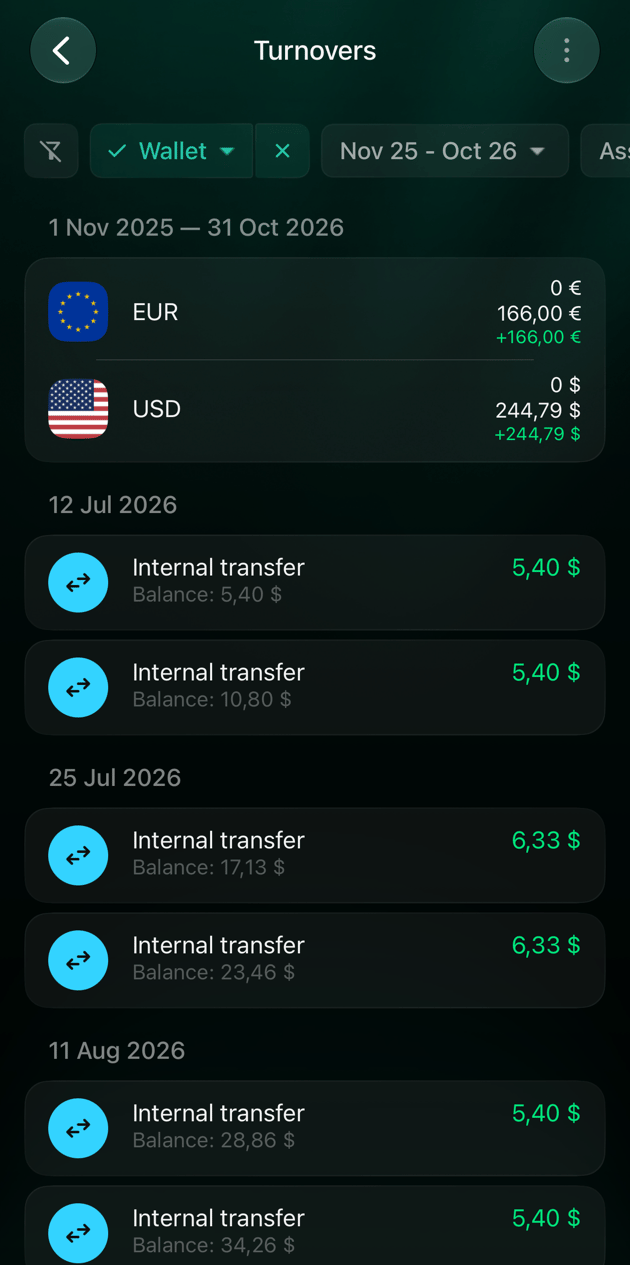
Tap an account group in **Net Worth**, then an account to open **Turnovers**. It opens the whole date range of the report, even if you had selected one column. Set the period in **Turnovers** if you want to investigate just one month.
The summary separates the account's currencies; the list shows movements and the balance after each one. Amounts recorded in **Turnovers** need not match the market valuation in Net Worth when exchange rates have changed.
Tap a column in **Networth**, then an account group and an account. **Turnovers** opens for that account and the period selected on the chart, with the balance changes behind it.
For the separate **Net Worth Change** and **Forex & Capital Gains** reports, use the web app.
Tap an account group in **Net Worth**, then an account to open **Turnovers**. It opens the whole date range of the report, even if you had selected one column. Set the period in **Turnovers** if you want to investigate just one month.
The summary separates the account's currencies; the list shows movements and the balance after each one. Amounts recorded in **Turnovers** need not match the market valuation in Net Worth when exchange rates have changed.
 For **Net Worth Change** and **Forex & Capital Gains**, use the web app.
Keep the underlying balances accurate
The report reflects what is recorded in finerd. If an amount looks wrong, check the account and the date before changing anything:
* **Missing money, property or a loan:** check that the account exists and has the right balance. The report cannot include something you have not recorded.
* **A surprising historical amount:** check the initial balance, dated transactions and later balance checks. An initial balance is the starting point; a current balance is what is on the account now; a verified balance is a check at a particular date. They are not interchangeable.
* **A debt pointing the wrong way:** check whether the account says **Owes me** or **I owe**. See [Track debts](/debts/track-debts).
* **An unexpected currency total:** inspect the currencies or assets inside the account and the valuation date. The same quantity can have a different value in the primary currency on another date.
Use [Verified balance](/verified-balance) to understand checks and balance corrections. Use [Create an account](/accounts/create-account) for property, loans and investment accounts, and [Income, expenses and cash flow](/reports/income-expenses-cash-flow) when the question is what you earned or spent rather than what you own and owe.
This documentation is built and hosted on [Mintlify](https://mintlify.com), a developer documentation platform.