> ## Documentation Index
> Fetch the complete documentation index at: https://help.finerd.ai/llms.txt
> Use this file to discover all available pages before exploring further.
# Customize a report
> Set a finerd report's period, step, date basis, grouping and filters, then save the set-up as your own report on the web, Android or iOS.
You can change any finerd report to answer a narrower question: pick the period and its step, count expenses by accrual month or by transaction date, group by category or merchant, and keep only the categories, merchants or tags you need. When a set-up is worth keeping, save it as your own report and open it from **Reports** next time.
Changing report settings works on the web, Android and iOS, and Expenses, Income, Cash Flow and Net Worth are free in your personal space. Saving a report is free on the web; on Android and iOS it needs Pro. A saved report stays in the browser or on the device where you saved it and doesn't sync to your other devices. For what each report shows, see [Analyze income, expenses and cash flow](/reports/income-expenses-cash-flow) and [Understand your net worth](/reports/net-worth).
What you can change
The settings sit in a row above the chart. Not every report has every setting:
| Setting | Expenses and Income | Cash Flow (Android: **Cashflow**) | Net Worth (Android: **Networth**) |
| - | - | - | - |
| Period and step | **Month**, **Quarter**, **Year** or **Custom** | **Month**, **Quarter**, **Year** or **Custom** | **Month**, **Quarter** or **Year** |
| Date basis | **Accrual month** or **Transaction date** | Always the transaction date | A balance at the end of each period |
| Grouping | **By category** or **By merchant**; with a family partner also **By purpose** and **By partner** | — | — |
| Filters | **Category**, **Merchant**, **Tag** | **Account**, **Non-cash movements** | **Account** |
A report can't be grouped by account or by tag, and Expenses and Income have no account filter. For those questions, see [When a report can't answer your question](#ai).
Choose the period and its step
The period picker sets both the dates and the step of the report: each column of the chart is one step.
* **Month**, **Quarter** and **Year** cover whole calendar months, quarters or years.
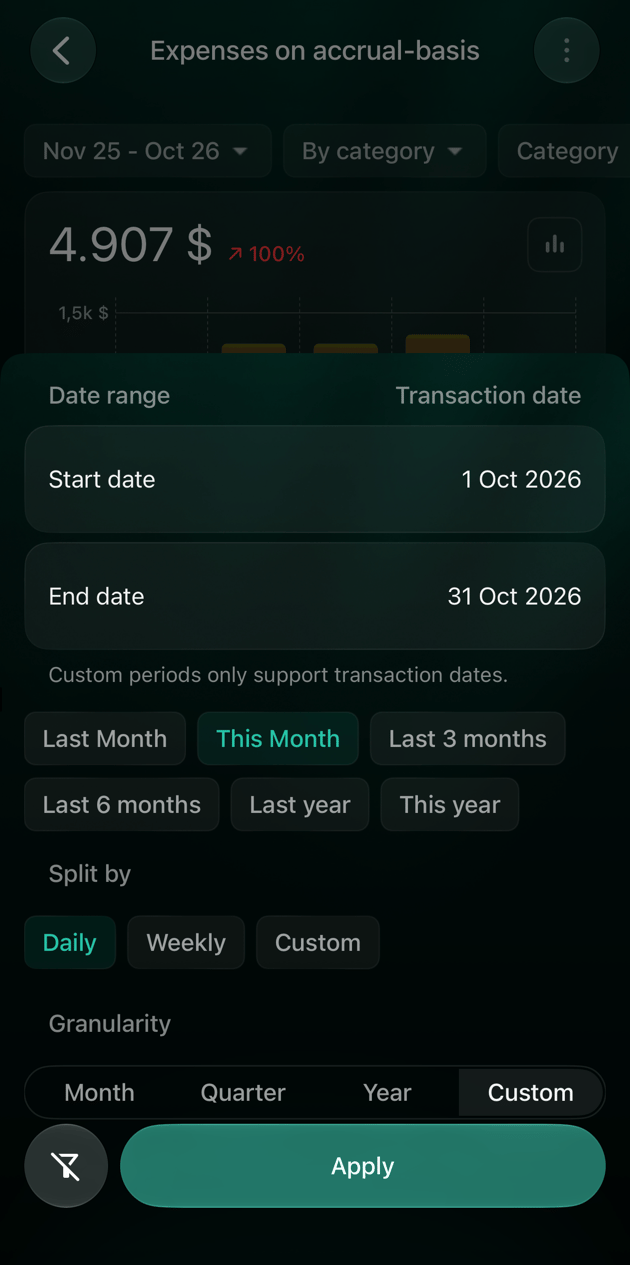
* **Custom** covers any dates, split **Daily**, **Weekly** or into your own number of days. Custom periods always count by transaction date.
Each step has quick choices, such as **This Month**, **Last Month** or **Last 6 months**. A new report opens on the past year month by month on the web and iOS, and on the last 6 months on Android. Changing the step can reset the dates, so choose the step first and the dates after it.
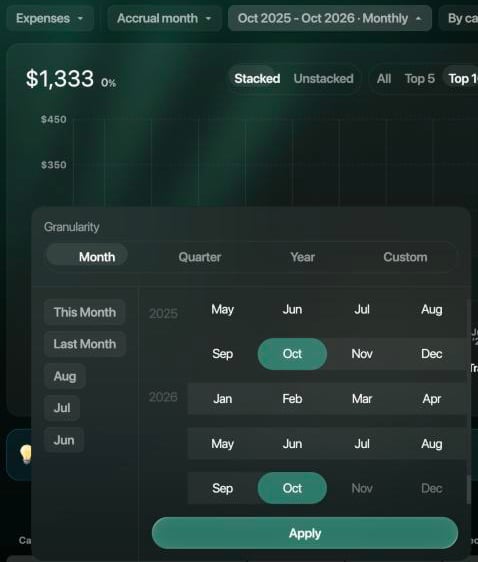
1. Select the period, for example **Oct 2025 - Oct 2026 · Monthly**.
2. Under **Granularity**, choose **Month**, **Quarter**, **Year** or **Custom**.
3. With **Custom**, choose **Split by**: **Daily**, **Weekly** or **Custom**, then enter the number of days in each step.
4. Select a quick choice on the left, which applies at once, or select the first and the last period in the calendar, then **Apply**.
 1. Tap the period at the top. The panel opens with **Date range**, **Start date** and **End date**.
2. Tap **Granularity** and choose **Month**, **Quarter**, **Year** or **Custom**.
3. With **Custom**, choose **Daily grouping**, **By 7 days** or **Custom grouping**, and enter from 1 to 365 days in **Days in period**.
4. Tap a quick choice or set the dates, then tap **Apply**.
1. Tap the period at the top, for example **Nov 25 - Oct 26**.
2. Under **Granularity**, choose **Month**, **Quarter**, **Year** or **Custom**.
3. With **Custom**, choose **Split by**: **Daily**, **Weekly** or **Custom**, and enter the number of days.
4. Tap a quick choice or set **Start date** and **End date**, then tap **Apply**.
1. Tap the period at the top. The panel opens with **Date range**, **Start date** and **End date**.
2. Tap **Granularity** and choose **Month**, **Quarter**, **Year** or **Custom**.
3. With **Custom**, choose **Daily grouping**, **By 7 days** or **Custom grouping**, and enter from 1 to 365 days in **Days in period**.
4. Tap a quick choice or set the dates, then tap **Apply**.
1. Tap the period at the top, for example **Nov 25 - Oct 26**.
2. Under **Granularity**, choose **Month**, **Quarter**, **Year** or **Custom**.
3. With **Custom**, choose **Split by**: **Daily**, **Weekly** or **Custom**, and enter the number of days.
4. Tap a quick choice or set **Start date** and **End date**, then tap **Apply**.
Accrual month or transaction date
In **Expenses** and **Income**, the date basis decides which month a transaction counts in:
| Setting | A transaction counts in | Use it to |
| - | - | - |
| **Accrual month** (the default) | The month it belongs to. It's the month of the transaction unless you change it, for example for one part of a [split](/transactions/split-transaction#change) | Compare months by what the money was for |
| **Transaction date** | The day it happened | Match the report with your bank statement; needed for **Custom** periods |
For example, a $60 purchase on October 5 split into $50 of Shopping and $10 of Coffee & Snacks, with the $10 part's accrual month set to September, counts $10 in September with **Accrual month** and the whole $60 in October with **Transaction date**. Cash Flow always uses the transaction date, and Net Worth shows the balances at the end of each period, so neither has this setting.
Select **Accrual month** next to **Expenses** and choose **Transaction date**, or the other way round.
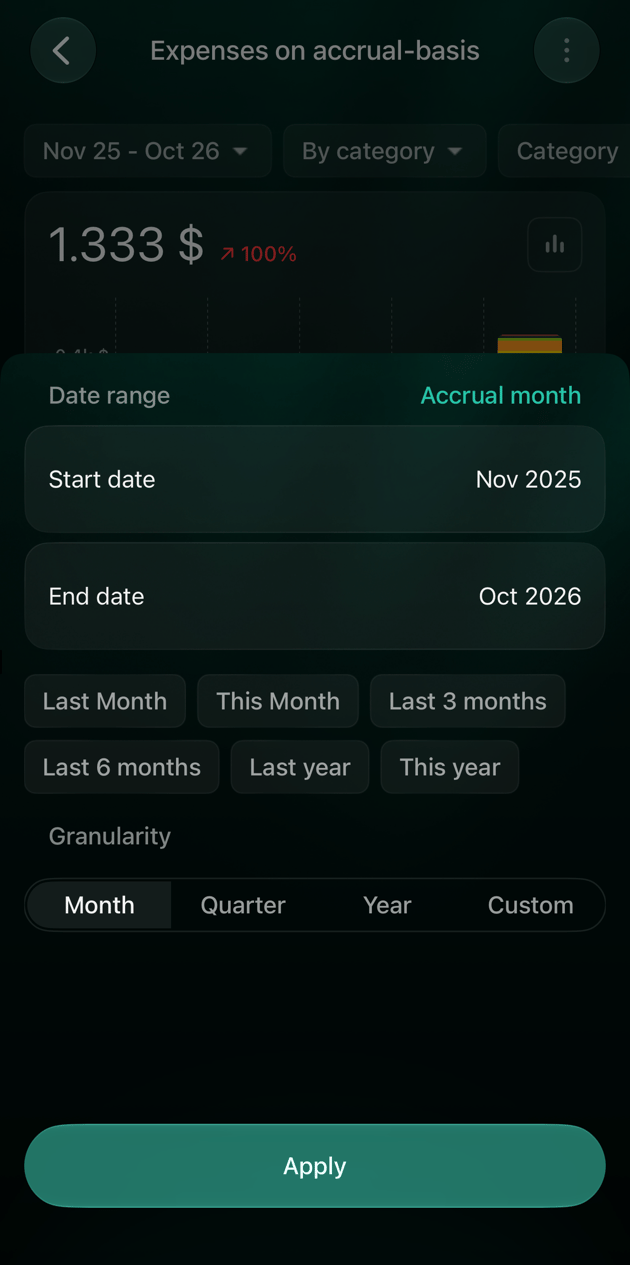
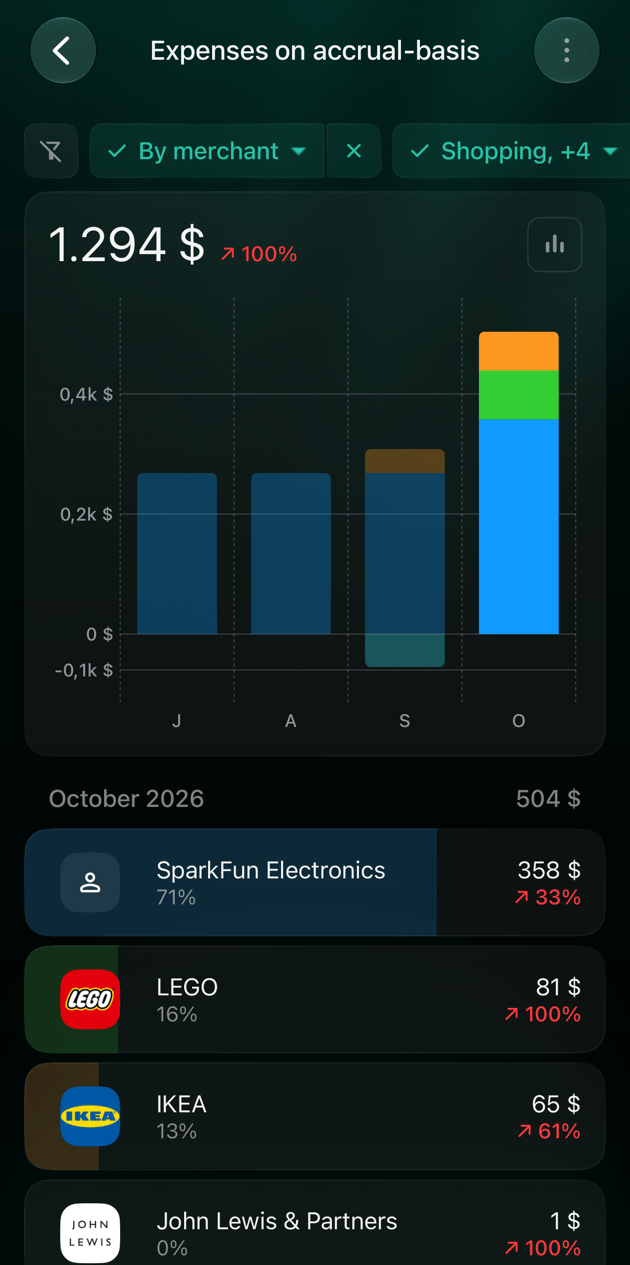
Tap the period, then the setting next to **Date range**, and choose **By accrual month** or **By transaction date**. Tap **Apply**. With the accrual month, the title reads **Expenses on accrual-basis**.
Tap the period, then **Accrual month** at the top right; it switches to **Transaction date**. Tap **Apply**. With the accrual month, the title reads **Expenses on accrual-basis**.
Group and filter
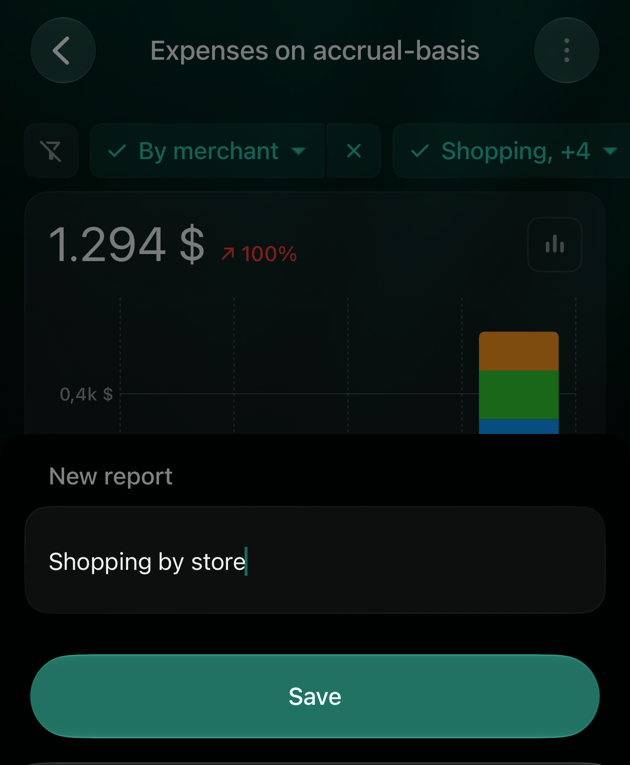
Grouping decides what each row of the report is; filters decide which transactions it counts. Together they answer a specific question. For example, to see which shops your **Shopping** money went to, choose **By merchant** and set the **Category** filter to **Shopping**.
* **By category** shows parent categories with their subcategories inside; **By merchant** shows shops and payers. **By purpose** (personal or family) and **By partner** (paid by you or your partner) need a partner connected through [Family](/reports/income-expenses-cash-flow#family).
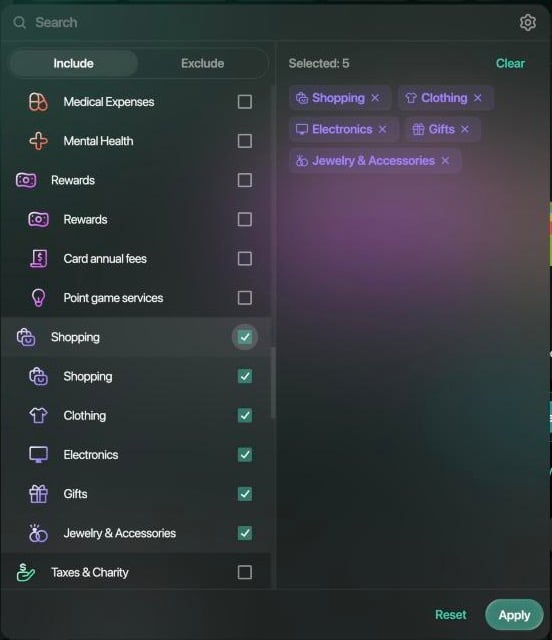
* **Category**, **Merchant** and **Tag** each have two tabs: **Include** keeps only what you choose, **Exclude** leaves it out. A filter that excludes shows **Excl:** before its first item. Choosing a parent category selects its subcategories too.
* Excluding a tag keeps the transactions that have no tags.
* In **Cash Flow**, **Account** keeps or leaves out accounts, and **Non-cash movements** can be hidden. In **Net Worth**, **Account** chooses the accounts in the total.
1. Select **By category** and choose **By merchant**, or the other way round.
2. Select **Category**, **Merchant** or **Tag**. Choose **Include** or **Exclude**, search if the list is long, and select the items. Select **Apply**.
3. To remove one filter, select the **×** on it. **Clear filters** returns the whole report to the default settings, even in a saved report.
 1. Tap **By category** and choose **By merchant**.
2. Tap **Categories**, **Merchants** or **Tags**, switch between **Include** and **Exclude**, select the items and tap **Apply**.
3. To remove one filter, tap the **×** on it. The first button in the row, without a label, removes all filters at once.
1. Tap **By category**, choose **By merchant** and tap **Apply**.
2. Swipe the row of filters to **Category**, **Merchant** or **Tag**. Choose **Include** or **Exclude**, select the items and tap **Apply**.
3. To remove one filter, tap the **×** next to it. The first button in the row, without a label, returns the whole report to the default settings.
1. Tap **By category** and choose **By merchant**.
2. Tap **Categories**, **Merchants** or **Tags**, switch between **Include** and **Exclude**, select the items and tap **Apply**.
3. To remove one filter, tap the **×** on it. The first button in the row, without a label, removes all filters at once.
1. Tap **By category**, choose **By merchant** and tap **Apply**.
2. Swipe the row of filters to **Category**, **Merchant** or **Tag**. Choose **Include** or **Exclude**, select the items and tap **Apply**.
3. To remove one filter, tap the **×** next to it. The first button in the row, without a label, returns the whole report to the default settings.
Save a report
A saved report keeps the report's period, step, date basis, grouping and filters under a name you choose. It appears in **Reports** next to the standard reports, and you can update, rename or delete it. You can save Expenses, Income, Cash Flow and Net Worth on every platform.
What a saved period means depends on the platform:
* **Android and iOS:** a quick choice such as **Last 6 months** moves with time, so next month the report shows the latest six months. Dates you set yourself, and every **Custom** period, stay fixed.
* **Web:** the period you chose is saved as fixed dates. If you didn't change the period, the report keeps showing the past year up to the current month.
Saved reports belong to the space and the browser or device where you saved them. They don't appear on your other devices, and on the web they're removed if you clear the site's data in the browser.
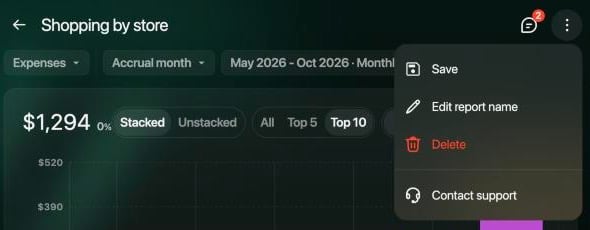
1. Set up the report, then select **⋮** at the top right and **Save settings**.
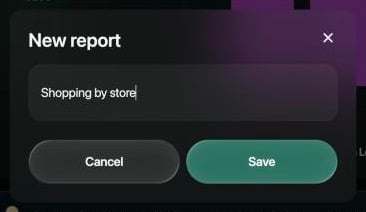
2. In **New report**, enter a name, for example **Shopping by store**, and select **Save**. The report opens under its new name.
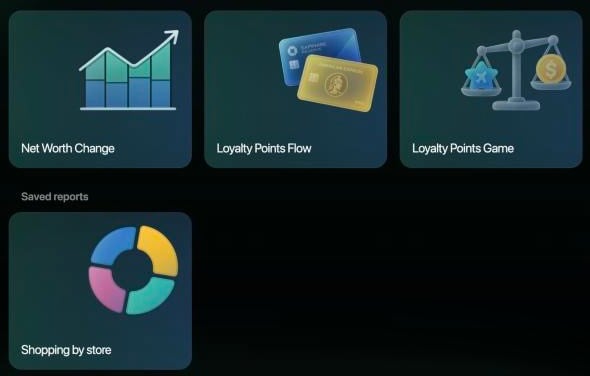
3. Next time, open **Reports**: your reports are under **Saved reports**, after **Preset reports**.
To change a saved report, open it, change the settings and select **⋮** → **Save**. The same menu has **Edit report name** and **Delete**; finerd asks you to confirm a deletion. The chart's look, such as columns or a ring and **Top 10**, is saved too.
 On the web, a filter you remove from a saved report comes back the next time you open it, even after **Save**. To drop a filter, set the report up again from the preset report and save it under a new name.
1. Set up the report, then tap **⋮** at the top right and **Save settings**. Without Pro, the item shows **Pro** and opens the plans.
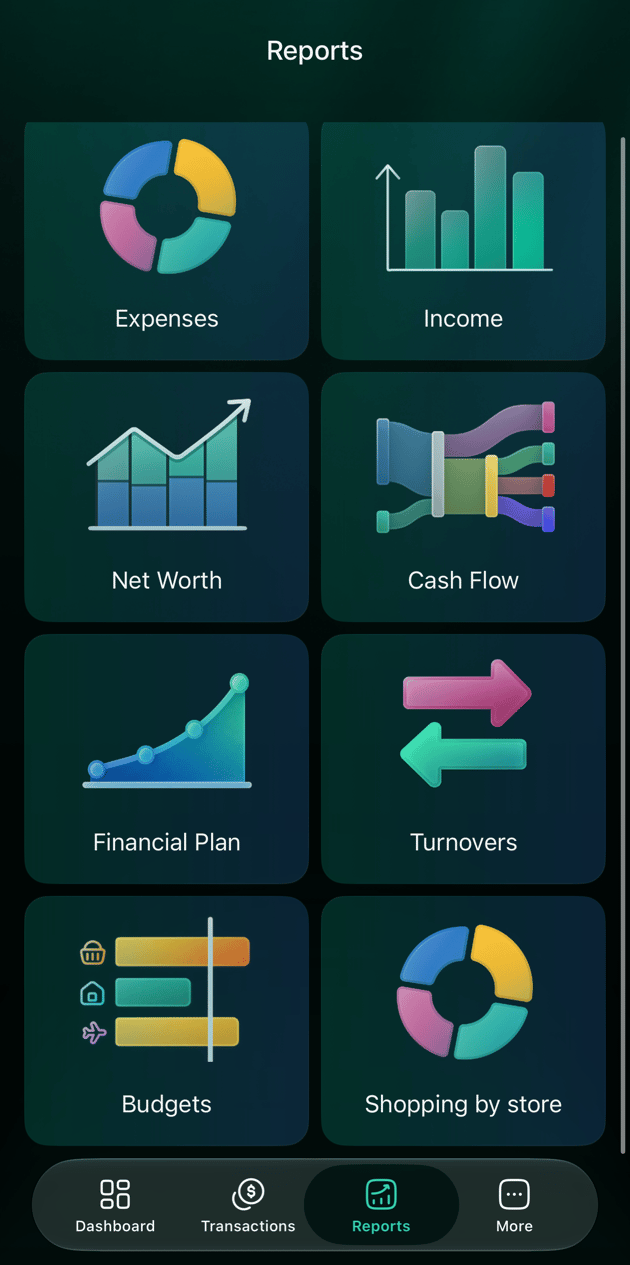
2. Enter a **Name** and tap **Save**. finerd returns to **Reports**, where the report is a new tile after the standard ones.
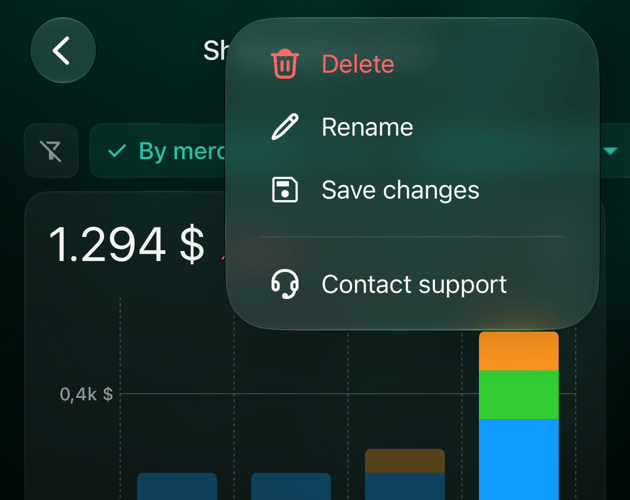
To change a saved report, open it, change the settings and tap **⋮** → **Save changes**. If you leave without saving, finerd asks whether to save the changes. The same menu has **Rename** and **Delete**; **Delete** removes the report at once, without asking. A saved report always opens with the bar chart.
1. Set up the report, then tap **⋮** at the top right and **Save settings**. Without Pro, the item shows **Pro** and opens the plans.
2. In **New report**, enter a name and tap **Save**. finerd returns to **Reports**, where the report is a new tile after the standard ones.
To change a saved report, open it, change the settings and tap **⋮** → **Save changes**. The same menu has **Rename** and **Delete**; **Delete** removes the report at once, without asking. A saved report always opens with the bar chart.
On the web, a filter you remove from a saved report comes back the next time you open it, even after **Save**. To drop a filter, set the report up again from the preset report and save it under a new name.
1. Set up the report, then tap **⋮** at the top right and **Save settings**. Without Pro, the item shows **Pro** and opens the plans.
2. Enter a **Name** and tap **Save**. finerd returns to **Reports**, where the report is a new tile after the standard ones.
To change a saved report, open it, change the settings and tap **⋮** → **Save changes**. If you leave without saving, finerd asks whether to save the changes. The same menu has **Rename** and **Delete**; **Delete** removes the report at once, without asking. A saved report always opens with the bar chart.
1. Set up the report, then tap **⋮** at the top right and **Save settings**. Without Pro, the item shows **Pro** and opens the plans.
2. In **New report**, enter a name and tap **Save**. finerd returns to **Reports**, where the report is a new tile after the standard ones.
To change a saved report, open it, change the settings and tap **⋮** → **Save changes**. The same menu has **Rename** and **Delete**; **Delete** removes the report at once, without asking. A saved report always opens with the bar chart.
When a report can't answer your question
Reports answer questions about categories and merchants, narrowed by tags. Some questions need more: spending paid from one card, or totals for several tags side by side. If you've [connected an AI assistant](/ai) to finerd, it can build a [custom report](/ai/custom-reports) for that question from the same data. To see the transactions behind a number in a report instead, see [See the transactions behind a number](/reports/income-expenses-cash-flow#details).
This documentation is built and hosted on [Mintlify](https://mintlify.com), a developer documentation platform.