> ## Documentation Index
> Fetch the complete documentation index at: https://help.finerd.ai/llms.txt
> Use this file to discover all available pages before exploring further.
# Build a financial plan
> Create a Financial Plan scenario from your finerd accounts, set your age, rates, inflation and investments, and read the net worth projection.
Financial Plan shows how your net worth could change year by year, from today until the end of your planned life expectancy. You build it as a **scenario**: finerd fills it in from the accounts, income and expenses you already track, and you adjust your age, growth and interest rates, inflation and how much you invest.
Financial Plan is a finerd Pro feature for personal spaces, on the web and in the iOS app. The Android app doesn't have it, and business spaces don't include it. To see why a plan is worth building, read [Why build a financial plan?](/financial-plan/why-build-a-financial-plan)
How a plan works
A scenario starts from your finances today and repeats the same calculation for every year (or month, or quarter) ahead:
* **Assets**, such as bank accounts, cash, stocks and crypto, real estate and vehicles, grow or lose value at their own rate.
* **Liabilities**, such as loans, mortgages and debts you owe, grow with interest and shrink with the payments you plan.
* **Income** minus **expenses** is what you have left each year. The part you choose to invest goes into your assets; the rest stays in your plan as cash.
* **Future events**, such as a pension from your retirement date, change these amounts from a given date. See [Add future events to your plan](/financial-plan/add-future-events).
finerd shows asset values in today's money: each year it takes inflation off their growth. With 3% inflation, a car at 0% loses about 3% of its value a year in the plan, and a flat that gains 5% a year grows by about 2%.
If expenses outgrow income, for example after you retire, finerd pays the difference from your assets, starting with cash. When the assets run out, the shortfall counts as debt and your net worth goes below zero.
Your first scenario is your **primary** one. The report, the dashboard widget and the warning about results that differ from the plan use it. You can add more scenarios to compare choices; see [Compare and update scenarios](/financial-plan/compare-scenarios).
Create your first scenario
When you create a scenario, finerd copies the current balances of your accounts and your income and expenses by category into it. Nothing in your accounts changes: the scenario is a separate copy you can edit.
1. Open **Reports** and select **Financial plan**.
2. Select **Create first scenario**.
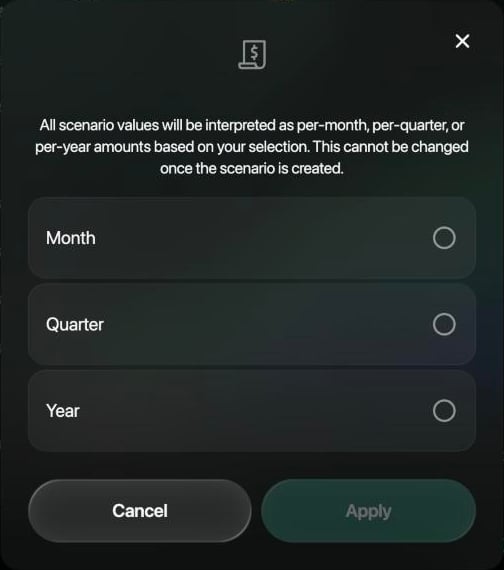
3. Choose **Month**, **Quarter** or **Year**, then select **Apply**. Every amount in the scenario is per month, per quarter or per year. You can't change this later.
4. Enter a name in **Scenario name**, such as **Base plan**.
5. Select **Birthdate** and choose your date of birth. finerd suggests a date 20 years ago, so change it.
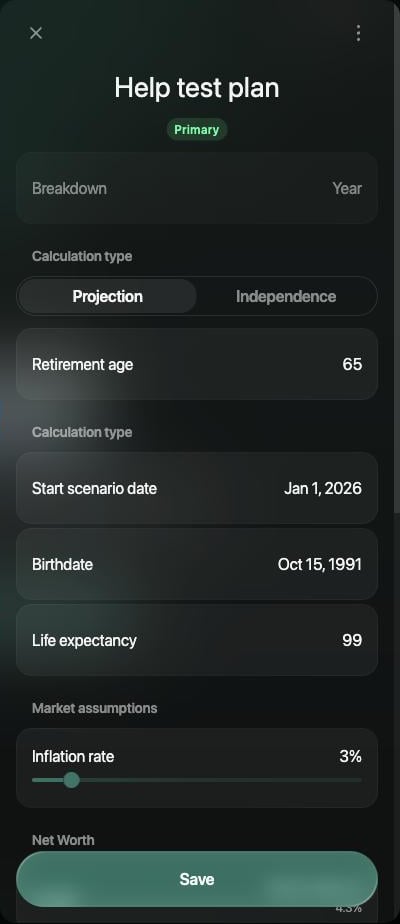
6. Check the other settings in the sections below, then select **Save**.
 1. Open the **Reports** tab and tap **Financial Plan**.
2. Tap **Create first scenario**.
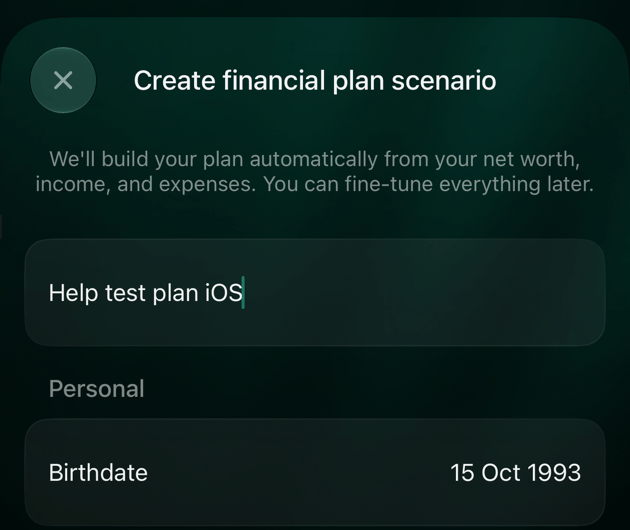
3. Enter a name in **Scenario Title**, such as **Base plan**.
4. Tap **Birthdate**, choose your date of birth and tap **Apply**.
5. Tap **Create**. finerd builds the plan with yearly amounts.
6. finerd offers to add a Financial Plan widget to your dashboard. Tap **Add widget** or **Not now**.
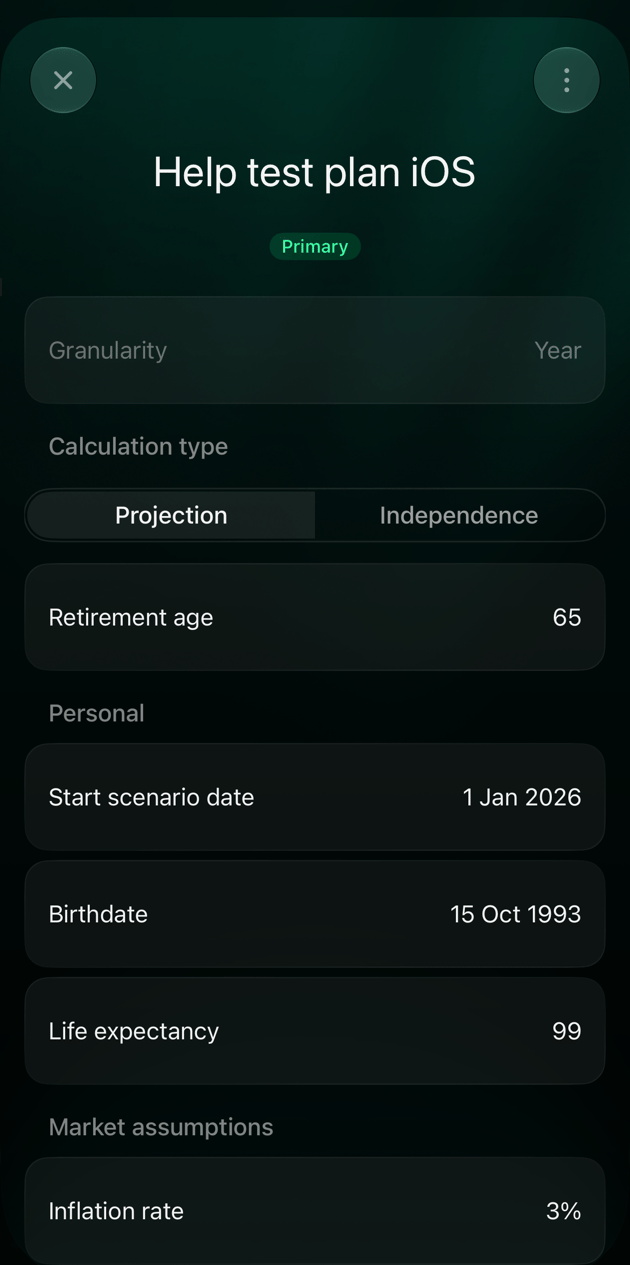
To change the other settings, tap **⋮** > **Scenario details**.
The report opens with your scenario. On the web, open its settings again with the pencil next to **Scenario:**; on iOS, tap **⋮** > **Scenario details**. Changes count only after you select **Save** in the scenario.
1. Open the **Reports** tab and tap **Financial Plan**.
2. Tap **Create first scenario**.
3. Enter a name in **Scenario Title**, such as **Base plan**.
4. Tap **Birthdate**, choose your date of birth and tap **Apply**.
5. Tap **Create**. finerd builds the plan with yearly amounts.
6. finerd offers to add a Financial Plan widget to your dashboard. Tap **Add widget** or **Not now**.
To change the other settings, tap **⋮** > **Scenario details**.
The report opens with your scenario. On the web, open its settings again with the pencil next to **Scenario:**; on iOS, tap **⋮** > **Scenario details**. Changes count only after you select **Save** in the scenario.
Set your age and timeline
These settings decide how long the plan runs and when you retire.
* **Calculation type**: **Projection** uses the **Retirement age** you enter (65 at first). **Independence** works out the earliest age you could stop working instead; see [Find your financial independence age](/financial-plan/compare-scenarios#independence).
* **Start scenario date**: **Beginning of current year** or **Today**. On iOS, changing it fills the scenario in again from your accounts and replaces the amounts you edited.
* **Birthdate**: sets your age in each year of the plan.
* **Life expectancy**: the plan runs until this age (99 at first). Born in 1991 with a life expectancy of 99, your plan ends in 2090.
On the web, set **Retirement age** before you save the scenario for the first time. If you change it later, the plan still stops your income and starts your pension at the age you first saved; to try another age, add a new scenario on the web. On iOS, a new scenario is saved with the default age as soon as you tap **Create**. See [Compare and update scenarios](/financial-plan/compare-scenarios#copy).
Check assets and liabilities
Select **Assets** or **Liabilities** under **Net Worth** to see the accounts finerd added. Each line shows the balance and a yearly rate. Select an account to change its amount or rate.
| Account type | Rate | Rate at first |
| - | - | - |
| Bank account | **Expected return rate** | 0% |
| Stocks & crypto | **Expected return rate** | 7% |
| Real estate | **Appreciation rate** | 5% |
| Vehicle | **Depreciation rate** | 0% |
| Loans & Mortgage | **Interest rate** | 4% |
| Debt you owe to a person | **Interest rate** | 5% |
Belongings such as furniture and electronics aren't in the **Assets** list, so you can't set their rates. The chart can still show them at their current value.
Set a bank account's rate to the interest it pays, and an investment's to the return you expect. Property and loans have their own articles: [Track property](/investments/track-property) and [Track a loan or mortgage](/investments/track-loan).
### Plan how loans are paid off
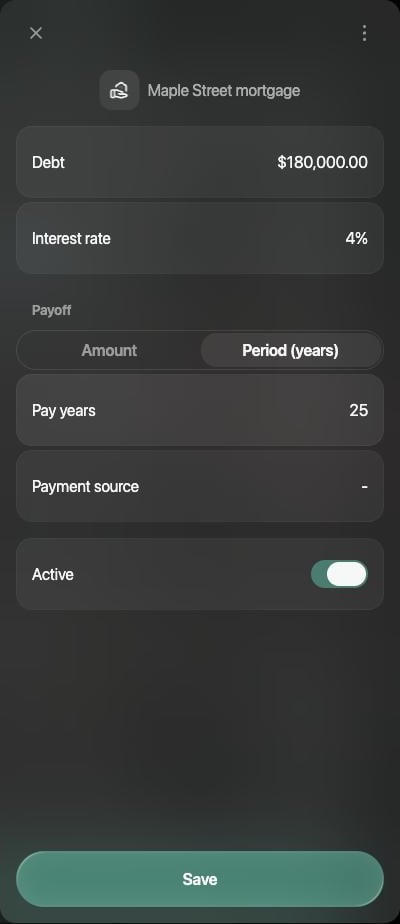
finerd adds each loan with its interest rate but no payments. Until you set them, the loan grows every year and pulls your net worth down. For each loan, open it and under **Payoff** choose:
* **Amount**, then enter the payment in **Annual pay**, or
* **Period (years)**, then enter how many years are left in **Pay years**. finerd works out equal payments that clear the loan in that time.
**Payment source** is the account the payments come from. Without one, they come out of what's left of your income.
An active loan with a balance needs a payment or a period. On the web, **Save** appears only after you set one; on iOS, **Apply** shows **Payoff Required**.
 ### Leave an account out
To keep an account out of the plan without deleting it, turn it off:
* **Web**: open the account and turn off **Active**.
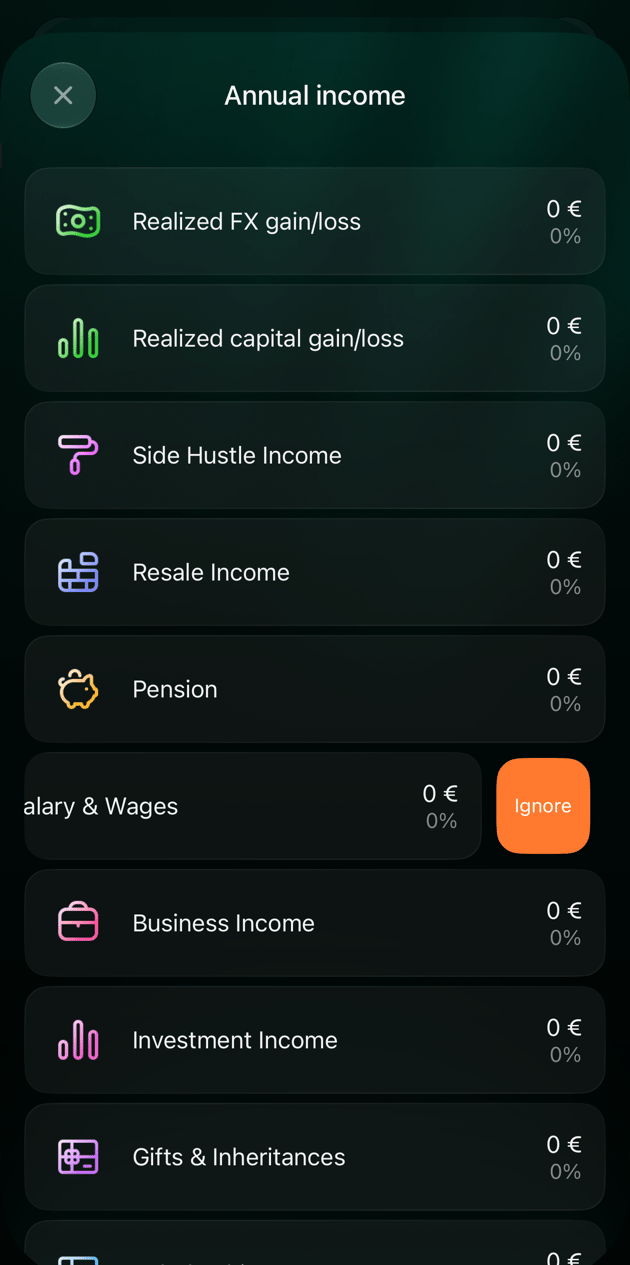
* **iOS**: swipe left on the account and tap **Ignore** (**Not ignore** brings it back), or open it and turn off **Active in scenario**.
The account stays in the list, dimmed, and doesn't count in the totals. The same works for income and expense categories.
### Leave an account out
To keep an account out of the plan without deleting it, turn it off:
* **Web**: open the account and turn off **Active**.
* **iOS**: swipe left on the account and tap **Ignore** (**Not ignore** brings it back), or open it and turn off **Active in scenario**.
The account stays in the list, dimmed, and doesn't count in the totals. The same works for income and expense categories.
 On the web, **Add account** at the end of the list creates a real account in your space, just like **Accounts** > **Add account**, and adds it to the plan.
Set income and expenses
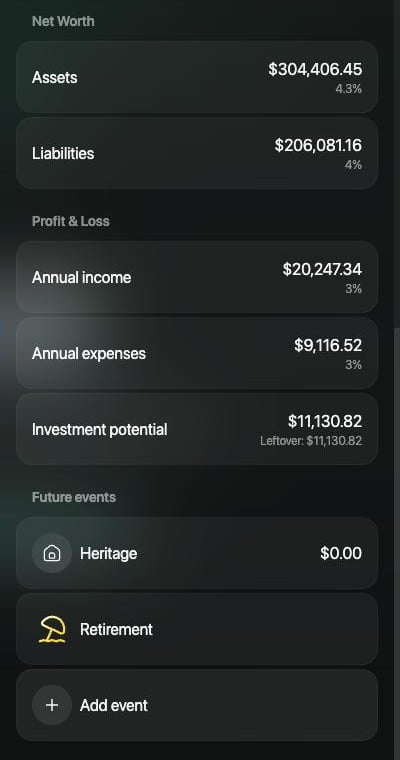
Under **Profit & Loss**, **Annual income** and **Annual expenses** hold your income and spending by category, based on your recent transactions. In a monthly or quarterly scenario, they're called **Monthly** or **Quarterly income** and **expenses**.
Select either to see the categories. Open a category to change its amount or how fast it grows: **Income growth rate** or **Expense growth rate**, 3% a year at first. A category with an amount of 0 is removed from the scenario when you save.
To change income or expenses from a future date, such as a raise, a new child or your pension, add an event instead; see [Add future events to your plan](/financial-plan/add-future-events).
Set inflation and growth rates
**Inflation rate** under **Market assumptions** is 3% at first. finerd uses it in two ways:
* It takes inflation off the growth of your assets, so the plan shows them in today's money.
* It's the growth rate for any income or expense without its own rate.
On the web, set inflation with a slider from 0% to 30%; on iOS, enter a percentage. Above 6%, finerd notes that the rate is historically high, and above 10%, that it's very high. You can still save it.
A rate shows how it compares with inflation, such as **Above inflation (3%)**. On iOS, finerd also notes an expected return above 15% as optimistic and above 20% as rarely sustainable.
Invest available money
**Investment potential** is your income minus your expenses: what's left to invest each year. **Leftover** is the part you haven't assigned yet.
To plan regular investing:
1. Select **Investment potential**.
2. Select the asset to invest in, such as a brokerage account.
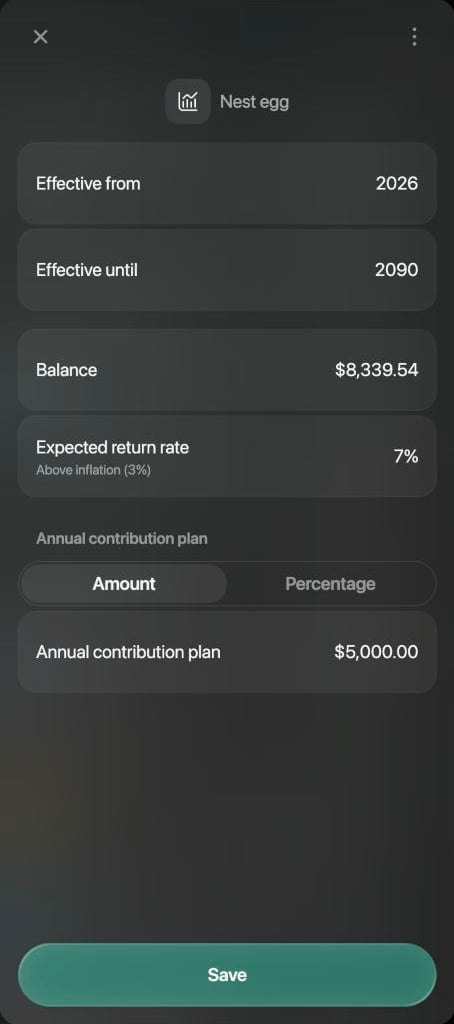
3. Under **Annual contribution plan** (or **Monthly** or **Quarterly**), choose:
* **Amount**, then enter how much you add each year, or
* **Percentage**, then choose an income category, such as your salary, and enter its share.
4. Select **Save** (on iOS, **Apply**), then save the scenario.
The contributions can't add up to more than the investment potential. On the web, you can't save while **Leftover** is below zero. Money you don't assign stays in your plan as cash, first in a cash account, and grows only at that account's rate. At 0%, it loses value to inflation.
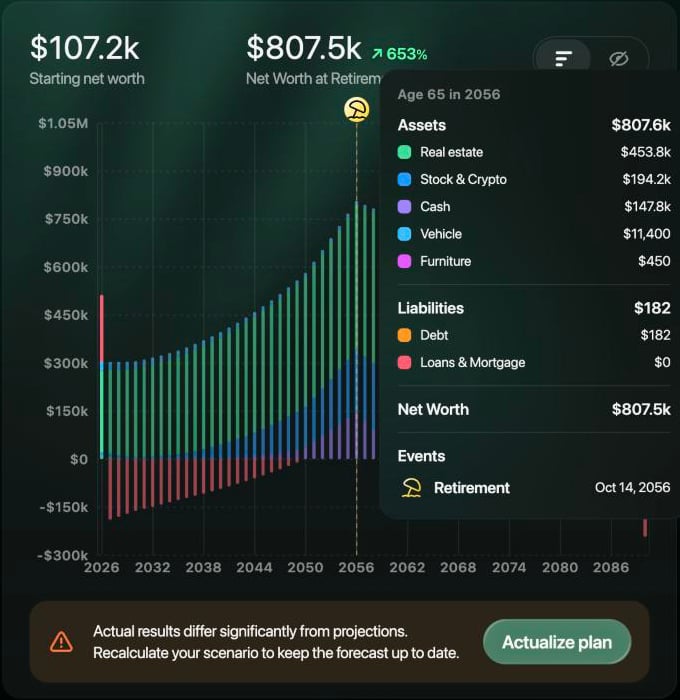
In the example, putting 5,000 USD a year into **Nest egg** at an expected 7% raised the plan's net worth at retirement from 713,000 to 807,500 USD.
Read your plan
The chart shows your net worth for every year of the plan: assets above zero, liabilities below it.
* **Starting net worth** is where the plan begins. **Net Worth at Retirement Age** is the plan's value in your retirement year, with the change from the start. It appears when the view is set to **Year**.
* An umbrella icon marks your retirement year.
* Point at a bar to see your age that year, the plan for each type of account and, for past and current years, your actual amounts with how far they are from the plan.
* **Year** next to the scenario name switches the chart to months or quarters.
* The eye icon hides the chart. The table under it lists the plan for each account type and account, year by year. **Copy** copies the table.
 * The header shows your net worth for the selected year and your age then. Tap a bar to select another year.
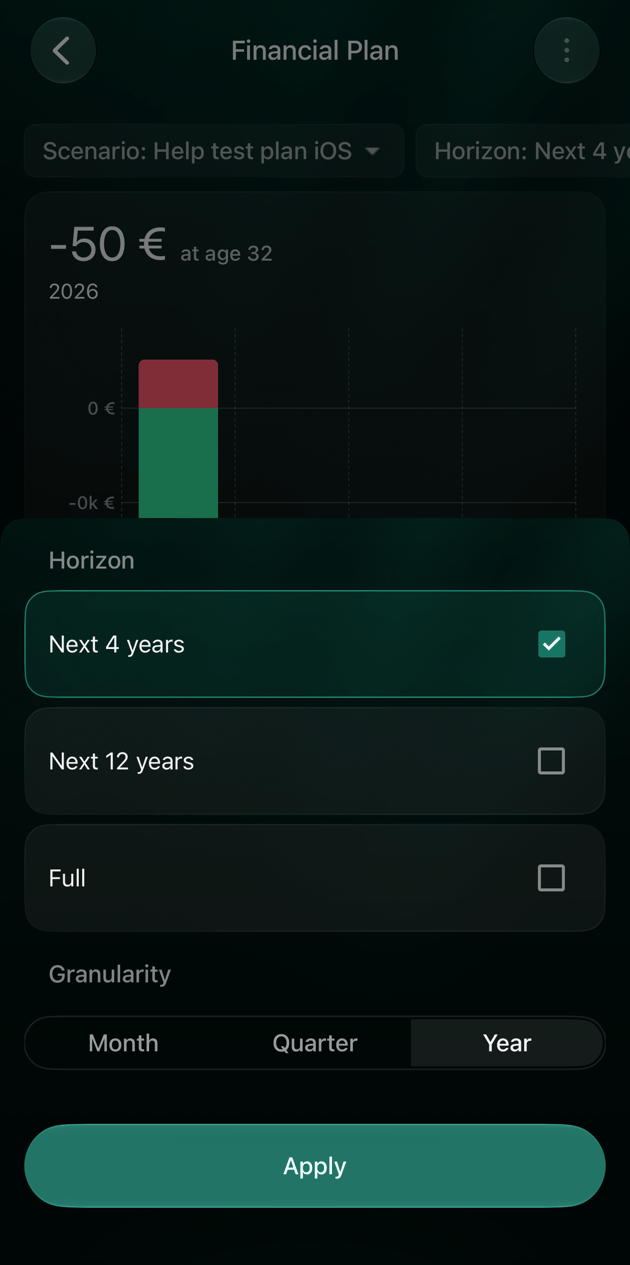
* **Horizon** sets how far ahead the chart looks: **Next 4 years**, **Next 12 years** or **Full**, and whether it shows months, quarters or years.
* For years that have passed, the solid part of a bar is your actual net worth and the faded part is the rest of the plan.
* **Breakdown** lists **Assets** and **Liabilities** for the selected year. **Fact** is your actual amount, and the badge shows how far along the plan you are. Tap a row to see each account.
* The header shows your net worth for the selected year and your age then. Tap a bar to select another year.
* **Horizon** sets how far ahead the chart looks: **Next 4 years**, **Next 12 years** or **Full**, and whether it shows months, quarters or years.
* For years that have passed, the solid part of a bar is your actual net worth and the faded part is the rest of the plan.
* **Breakdown** lists **Assets** and **Liabilities** for the selected year. **Fact** is your actual amount, and the badge shows how far along the plan you are. Tap a row to see each account.
 Actual amounts come from all the assets and liabilities in your space, the same figures as in the [Net Worth report](/reports/net-worth).
If your actual results drift far from the plan, finerd suggests updating it. See [Update the plan with actual results](/financial-plan/compare-scenarios#actualize).
Actual amounts come from all the assets and liabilities in your space, the same figures as in the [Net Worth report](/reports/net-worth).
If your actual results drift far from the plan, finerd suggests updating it. See [Update the plan with actual results](/financial-plan/compare-scenarios#actualize).
Next steps
* [Add future events to your plan](/financial-plan/add-future-events): a home or car purchase, a child, a new job, a loan or your pension.
* [Compare and update scenarios](/financial-plan/compare-scenarios): copy a scenario to try another choice, compare scenarios side by side, find your financial independence age and keep the plan in line with your actual results.
* [What \$1,000 can become](/financial-plan/what-1000-can-become): how compound growth works.
This documentation is built and hosted on [Mintlify](https://mintlify.com), a developer documentation platform.