> ## Documentation Index
> Fetch the complete documentation index at: https://help.finerd.ai/llms.txt
> Use this file to discover all available pages before exploring further.
# View business reports in finerd
> See your business's profit, balance sheet and cash flow in finerd, and choose which reports each team member can open.
A business space in finerd has two reports of its own: **Profit & Loss**, which shows whether the business earned more than it spent, and **Balance Sheet**, which shows what it owns, what it owes and how much belongs to its owners. Next to them are the familiar **Expenses**, **Income** and **Cash Flow** reports, and you decide which of them each team member can open.
**Profit & Loss** is on the web and iOS, and **Balance Sheet** is on the web only. The Android app doesn't have either: it shows only **Expenses**, **Income** and **Cashflow** for a business space. Business reports are part of the business space's own subscription, which starts with a 34-day trial; your Personal space's Pro doesn't cover them.
Reports in a business space
First, [switch to your business space](/business/create-business-space#switch). Then open **Reports** and pick the report that answers your question:
| Your question | Report | Where |
| - | - | - |
| Did the business make a profit? | **Profit & Loss** | Web, iOS |
| What does the business own and owe, and what's left for the owners? | **Balance Sheet** | Web |
| Did more money come into the business's accounts than went out? | **Cash Flow** (Android: **Cashflow**) | Web, Android, iOS |
| What did the business spend on, or earn from? | **Expenses**, **Income** | Web, Android, iOS |
| What happened in one account? | **Turnovers** | Web, iOS; on Android from the account's **⋮** menu |
| How did exchange rates change the value of foreign-currency money or investments? | **Forex & Capital Gains** | Web |
A business space doesn't have **Net Worth**, **Budget**, **Financial plan** or **Family spending**: these are for personal finances. Android still lists **Networth** and **Budget** in a business space, but they don't open there. For **Expenses**, **Income** and **Cash Flow**, see [Analyze income, expenses and cash flow](/reports/income-expenses-cash-flow).
Select **Reports** in the sidebar. In a business space, the list has **Expenses**, **Income**, **Cash Flow**, **Turnovers**, **Profit & Loss**, **Balance Sheet** and **Forex & Capital Gains**.
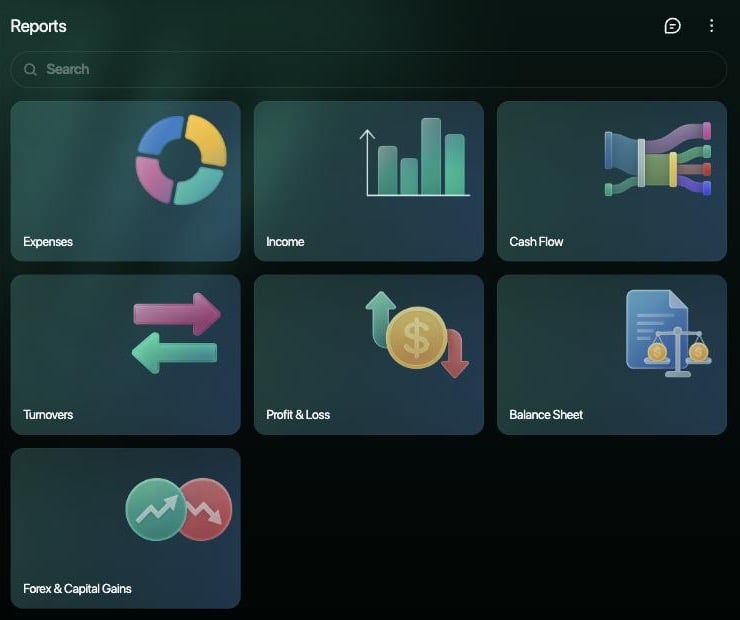 Tap **Reports** in the tab bar (or under **More**). For a business space, use **Expenses**, **Income** and **Cashflow**. For **Profit & Loss**, use the web or the iOS app; for **Balance Sheet**, use the web.
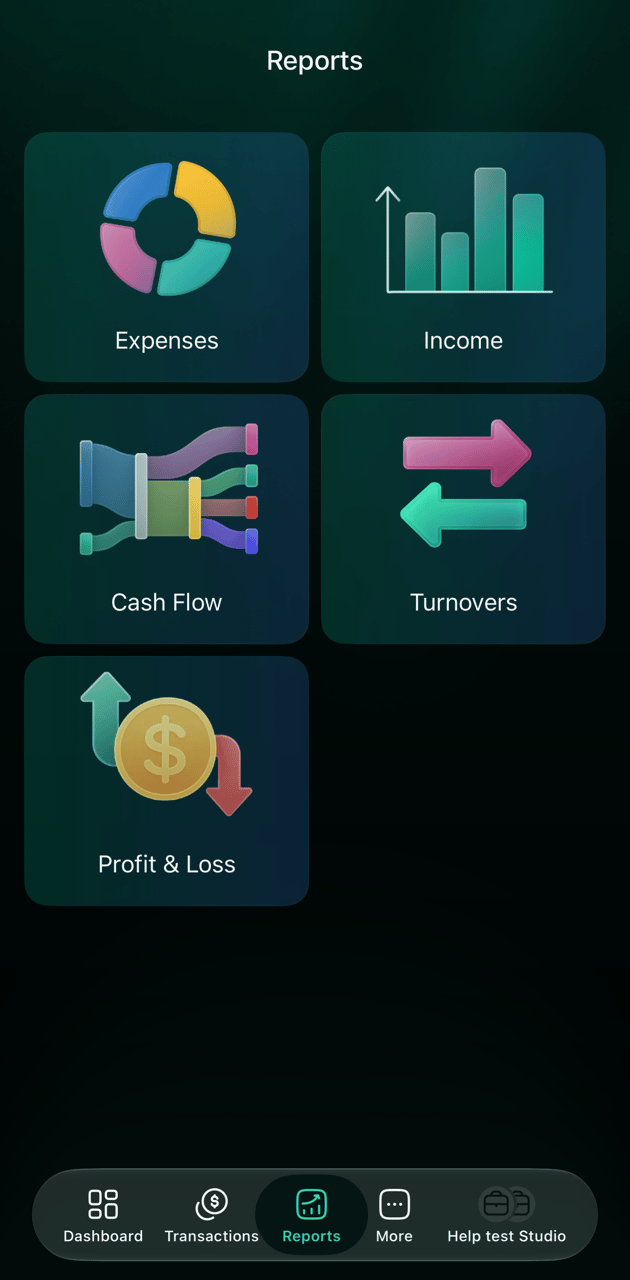
Tap **Reports** in the tab bar. In a business space, the list has **Expenses**, **Income**, **Cash Flow**, **Turnovers** and **Profit & Loss**.
Tap **Reports** in the tab bar (or under **More**). For a business space, use **Expenses**, **Income** and **Cashflow**. For **Profit & Loss**, use the web or the iOS app; for **Balance Sheet**, use the web.
Tap **Reports** in the tab bar. In a business space, the list has **Expenses**, **Income**, **Cash Flow**, **Turnovers** and **Profit & Loss**.
Read Profit & Loss
**Profit & Loss** puts the business's income and expenses side by side. **Net Profit** is income minus expenses for the period; a negative amount is a loss.
* Each income and expense counts in its **accrual month**, the month it belongs to, which is usually the month of the transaction. Unlike **Expenses** and **Income**, Profit & Loss has no **Transaction date** option. See [Accrual month or transaction date](/reports/customize-report#date-basis).
* Only income and expense categories count. Money the owners put in or take out, transfers between the business's accounts and debts aren't income or expenses, so they don't change the profit; see [Equity in reports](/business/track-equity#reports).
* The period can be split by **Month**, **Quarter** or **Year**. You can group by category or merchant and filter by **Category**, **Merchant** and **Tag**, as in other reports; see [Customize a report](/reports/customize-report).
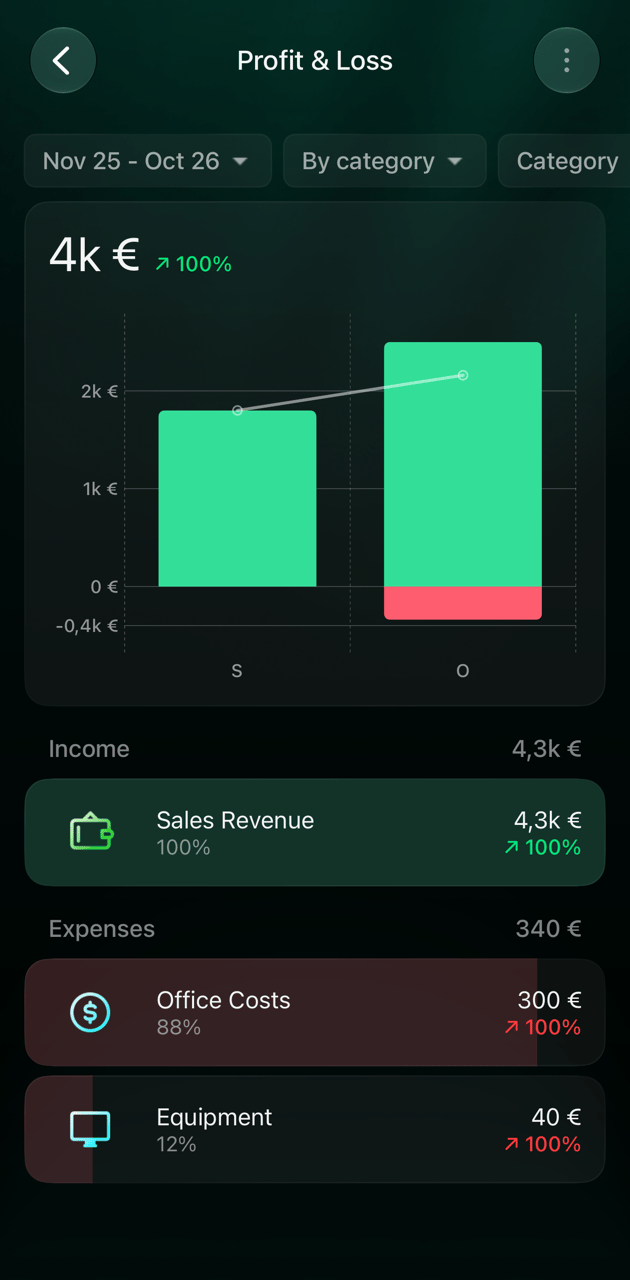
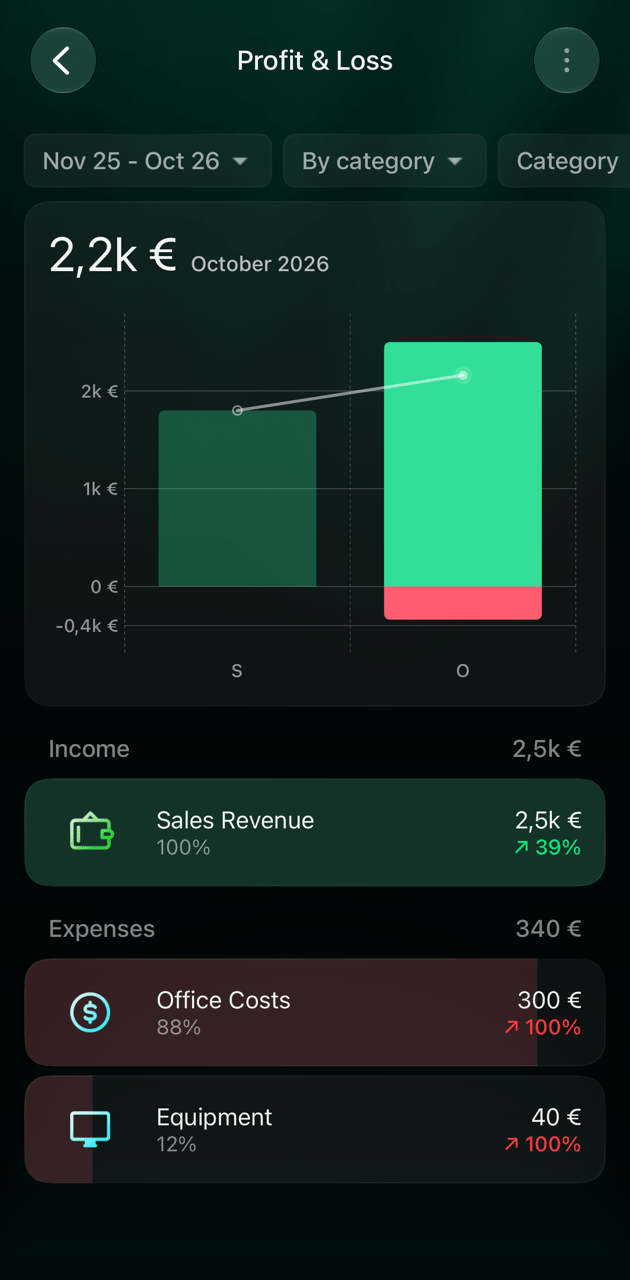
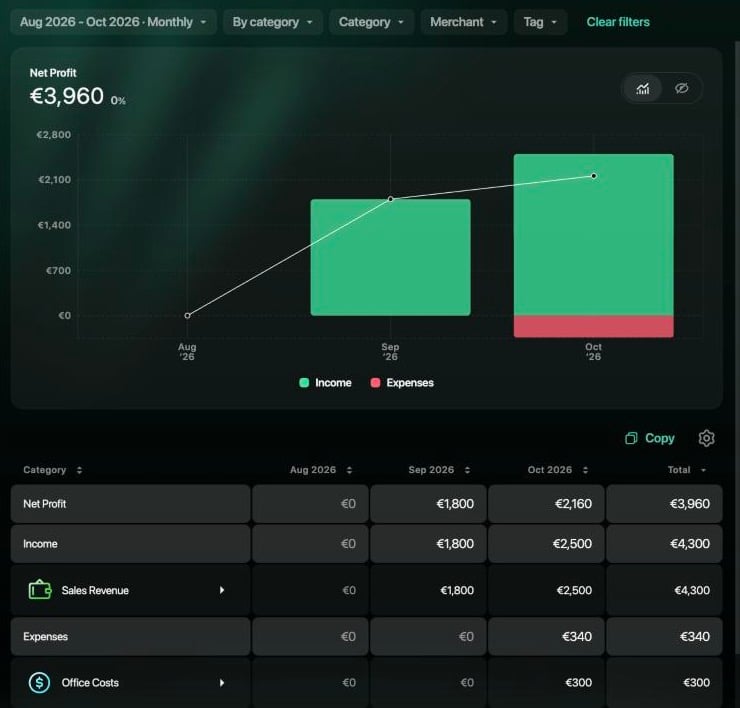
For example, a business that earned €1,800 in September, and €2,500 in October while spending €340, shows a **Net Profit** of €1,800 for September, €2,160 for October and €3,960 for the two months together.
1. In **Reports**, select **Profit & Loss**.
2. Select the period at the top to change the months and choose **Month**, **Quarter** or **Year**.
3. **Net Profit** for the whole period is above the chart. The chart shows income above zero and expenses below for each period, with a line for the net profit.
4. The table has a **Net Profit** row, then **Income** and **Expenses** with their categories, a column for each period and a **Total**. Select a category to narrow the report to it, or select an amount to open its transactions.
To paste the table into a spreadsheet, select **Copy** above it.
 The Android app doesn't have **Profit & Loss**. Open it on the web or in the iOS app.
1. In **Reports**, tap **Profit & Loss**.
2. Tap the period at the top to change the months and choose **Month**, **Quarter** or **Year**, then tap **Apply**.
3. The amount above the chart is the net profit for the whole period. The chart shows income above zero and expenses below for each period, with a line for the net profit. Tap a column to see that period's net profit and categories.
4. Under **Income** and **Expenses**, tap a category to narrow the report to it. A category without subcategories then lists its merchants; tap a merchant to open its transactions.
The Android app doesn't have **Profit & Loss**. Open it on the web or in the iOS app.
1. In **Reports**, tap **Profit & Loss**.
2. Tap the period at the top to change the months and choose **Month**, **Quarter** or **Year**, then tap **Apply**.
3. The amount above the chart is the net profit for the whole period. The chart shows income above zero and expenses below for each period, with a line for the net profit. Tap a column to see that period's net profit and categories.
4. Under **Income** and **Expenses**, tap a category to narrow the report to it. A category without subcategories then lists its merchants; tap a merchant to open its transactions.
Read the Balance Sheet
**Balance Sheet** shows the business's position at the end of each month, quarter or year: what it owns, what it owes and what belongs to its owners. It's on the web only.
| Row | What it holds |
| - | - |
| **Total Assets** | The money and property the business holds: bank and cash accounts, investments, property |
| **Total Liabilities** | What the business owes: loans, and debts such as costs you paid for it from your Personal space |
| **Total Equity** | What belongs to the owners: money put in and taken out through [equity accounts](/business/track-equity), **Accumulated profit** and, if the business holds foreign currency or investments, **Revaluation reserve** |
* **Accumulated profit** is all the business's income minus all its expenses from its first transaction to the end of the period. It counts each transaction on its date, so a transaction with a different accrual month can fall into another period here than in Profit & Loss.
* **Revaluation reserve** is the gain or loss on foreign currency and investments the business still holds, from exchange rates and prices.
* Every amount is in the space's primary currency, converted at the rate on the last day of each period.
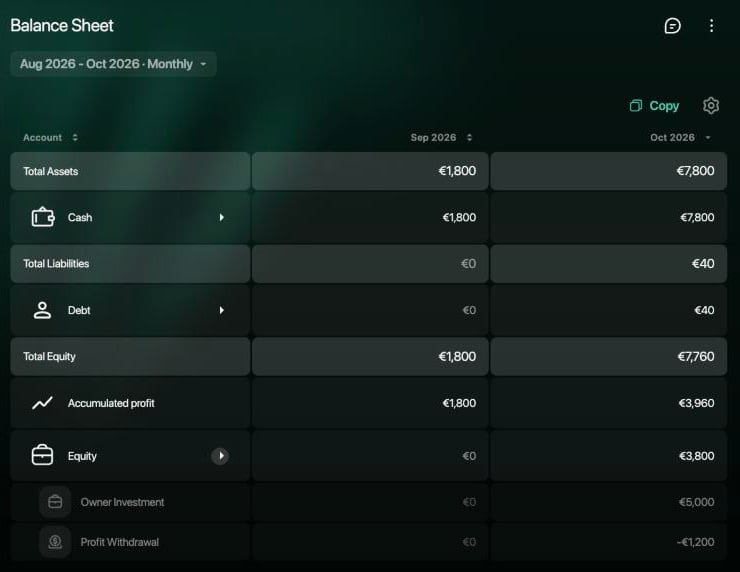
**Total Assets** always equals **Total Liabilities** plus **Total Equity**. For example, a business with €7,800 in its cash account that owes its owner €40 has **Total Equity** of €7,760: €5,000 the owner put in, minus €1,200 taken out, plus €3,960 of accumulated profit.
1. In **Reports**, select **Balance Sheet**.
2. Select the period at the top and choose **Month**, **Quarter** or **Year**. Each column shows the balances at the end of that period.
3. Select the arrow next to a row to see its account types and accounts.
4. Select **Accumulated profit** to open Profit & Loss for the same period, or an account to open its **Turnovers**.
To paste the table into a spreadsheet, select **Copy** above it.
 The Android app doesn't have **Balance Sheet**. Open it on the web.
The iOS app doesn't have **Balance Sheet**. Open it on the web.
The Android app doesn't have **Balance Sheet**. Open it on the web.
The iOS app doesn't have **Balance Sheet**. Open it on the web.
Profit or cash: Profit & Loss and Cash Flow
Profit isn't the same as the money in the business's accounts. **Profit & Loss** counts what the business earned and spent. **Cash Flow** counts the money that came into and went out of its bank and cash accounts, whatever the reason:
* Money the owners put in or take out is in **Cash Flow**, under **Other**, but not in Profit & Loss.
* A cost you paid from your own pocket counts as a business expense in Profit & Loss straight away, but the business's accounts don't change until it pays you back.
* Cash Flow always uses the transaction date; Profit & Loss uses the accrual month.
For example, in the October above the business made €2,160 of profit, but the money in its accounts grew by €6,000: the owner also put in €5,000 and took out €1,200, and the owner paid the €40 desk personally.
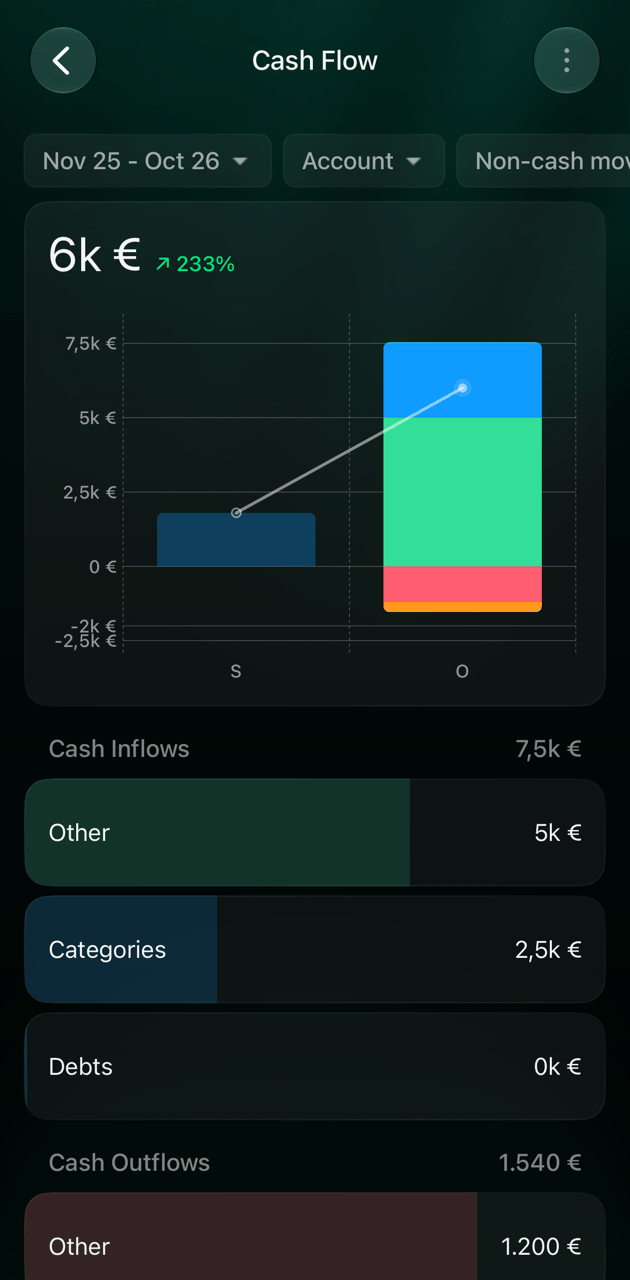 For how Cash Flow groups money and how to open it on each platform, see [Cash flow](/reports/income-expenses-cash-flow#cash-flow).
Who can see business reports
Every report in a business space needs the business space's subscription, including **Expenses** and **Income**, which are free in a Personal space. A new business space has a 34-day trial; after it ends, the space locks until it's paid for. See [Pay for a business space](/business/create-business-space#subscription).
Inside the space, a person's role decides which reports they see. When you choose a role on the web, finerd selects these reports for it:
| Role | Reports |
| - | - |
| **Owner** | All reports |
| **Admin**, **Accountant** | **Expenses**, **Income**, **Cash Flow**, **Profit & Loss**, **Balance Sheet** and **Forex & Capital Gains** |
| **Viewer** | **Expenses** and **Income**; you can add **Profit & Loss** and **Balance Sheet**, but not **Cash Flow** |
| **Member** | No reports |
An admin or accountant always keeps **Profit & Loss**, **Balance Sheet** and **Forex & Capital Gains**, even if you clear them in the report list. A viewer who gets **Balance Sheet** can also open **Forex & Capital Gains**. A member records transactions but can't open reports; give them the **Viewer** or **Accountant** role if they need them.
To change which reports someone sees, use the web:
1. Select your profile at the bottom of the sidebar, open the settings icon, then select **Space members**.
2. Open the person's row. Under **Permissions**, open **Reports** and select or clear reports.
3. Select **Save**.
You need the **Owner** or **Admin** role to change someone's access. For roles, invitations and seats, see [Invite and manage business-space members](/business/manage-members#roles).
A person without access to a report doesn't see it in the web list. On iOS, someone without any report access sees **You don’t have access. Ask admin or owner for upgrade.** when they open **Reports**. Android shows the same list to everyone and shows an error if the person can't open a report.
Share figures with your accountant
* **Give them access.** Invite your accountant to the business space with the **Accountant** role, or as a **Viewer** with only the reports they need. See [Invite a teammate](/business/manage-members#invite).
* **Copy a report.** On the web, **Copy** above the table of Profit & Loss, Balance Sheet or Cash Flow copies it as text you can paste into a spreadsheet or an email.
* **Keep your settings.** **Save settings** in a report's **⋮** menu saves the period and filters as your own report. It stays in the browser or on the device where you saved it; see [Save a report](/reports/customize-report#save).
* **Export the data.** The owner, an admin or an accountant can use **Export data** in the space settings. It sends a ZIP with the business's transactions and its Income, Expense and Cash flow reports as CSV files, for the whole history. It doesn't include Profit & Loss or Balance Sheet. See [Export your data from finerd](/account/export-data).
* [Track business equity](/business/track-equity)
* [Invite and manage business-space members](/business/manage-members)
* [Create a business space](/business/create-business-space)
* [Analyze income, expenses and cash flow](/reports/income-expenses-cash-flow)
* [Customize a report](/reports/customize-report)
This documentation is built and hosted on [Mintlify](https://mintlify.com), a developer documentation platform.